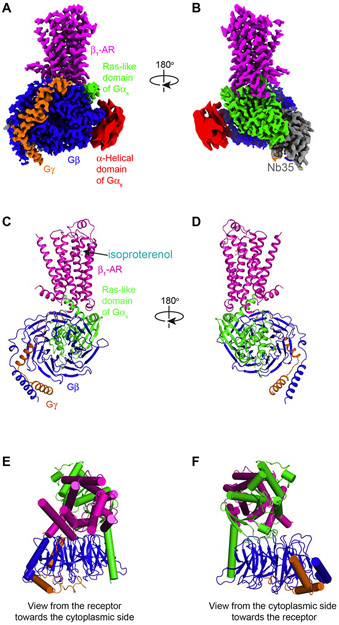
Figure 1. Overall architecture of the structure of the isoproterenol–β1-AR–Gs complex.
(A,B) Orthogonal views of the cryo-EM density map of the isoproterenol–β1-AR–Gs complex colored by subunits (β1-AR in magenta, Ras-like GTPase domain of Gαs in green, α-helical domain of Gαs in red (low-pass filtered to 6 Å for better presentation), Gβ in blue, Gγ in orange, and Nb35 in gray). (C,D) Cartoon diagrams of the isoproterenol–β1-AR–Gs complex are shown without Nb35 and the α-helical domain of Gαs. Color schemes are the same as in A and B. (E,F) Extracellular and cytoplasmic views of the isoproterenol–β1-AR–Gs complex.

