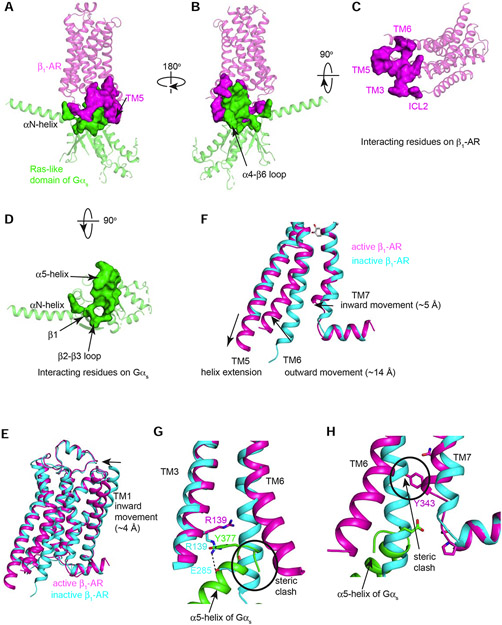
Figure 2. Molecular recognition of Gs by β1-AR.
(A-D) Different views of the interaction surface areas between β1-AR (in magenta) and the Ras-like GTPase domain of Gαs (in green) are shown. (E-H) Comparison of the conformations of β1-AR in the active state (magenta) as seen in the β1-AR–Gs complex and with that of β1-AR in the inactive state (PDB: 4GPO) (cyan). (E) The overall alignment of the inactive β1-AR and the active β1-AR. (F) Major conformational changes in TM5, TM6 and TM7. (G and H) Conformational changes in the conserved D(E)RY motif on TM3 (G) and the conserved NPxxY motif on TM7 (H).

