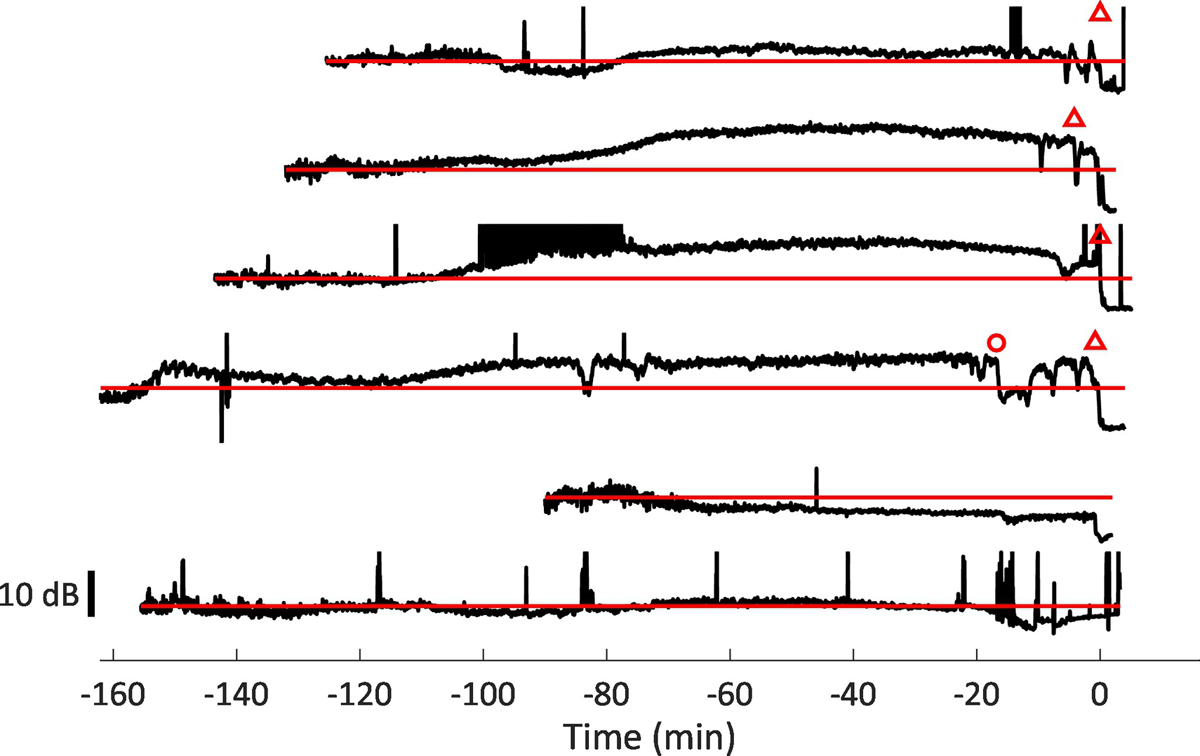
Figure 1:

Electrocorticography (ECoG) recordings from all animals (n = 6) with kainic acid seizures that died during seizure. Open triangles denote onset of obstructive apnea. Open circle denotes an extended period of multiple central apneas which was followed by a period of ECoG depression. ECoG is presented as the RMS of the signal, in 3 second bins. Horizontal red lines (grey in print version) denote baseline ECoG, which is collected in the first 5 min of each experiment, before seizures are induced. Each trace represents a separate experiment, and includes all data, including baseline for the first 5 min, until data recording stopped after death. Times are normalized so that death occurs at 0 min for each trace, and kainic acid was injected after the first five minutes of data shown. The top four traces represent animals which experienced sudden obstructive apnea and death. The bottom two traces represent animals which experienced gradual respiratory depression and hypoxia. Animals that suddenly died have ECoG signals that are much larger than baseline until obstructive apnea and death. Animals that experience respiratory depression have ECoG signals that gradually decline until death.
