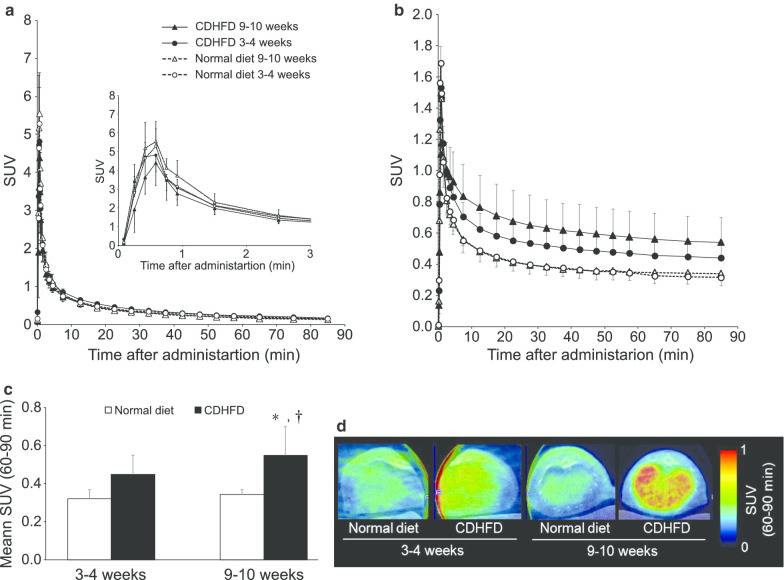
Fig. 4.
SUV profile and representative colour-coded PET images. a Left ventricular time-activity curve and b hepatic time-activity curve after 18F-FPP-RGD2 administration. c Mean SUV and d representative PET/CT fusion images 60–90 min after 18F-FPP-RGD2 administration. Values are expressed as means ± SDs (n = 5). *P < 0.05 compared with the 3–4-week normal diet-fed group; †P < 0.05 compared with 3–4-week CDHFD-fed group. CDHFD choline-deficient, low-methionine high-fat diet

