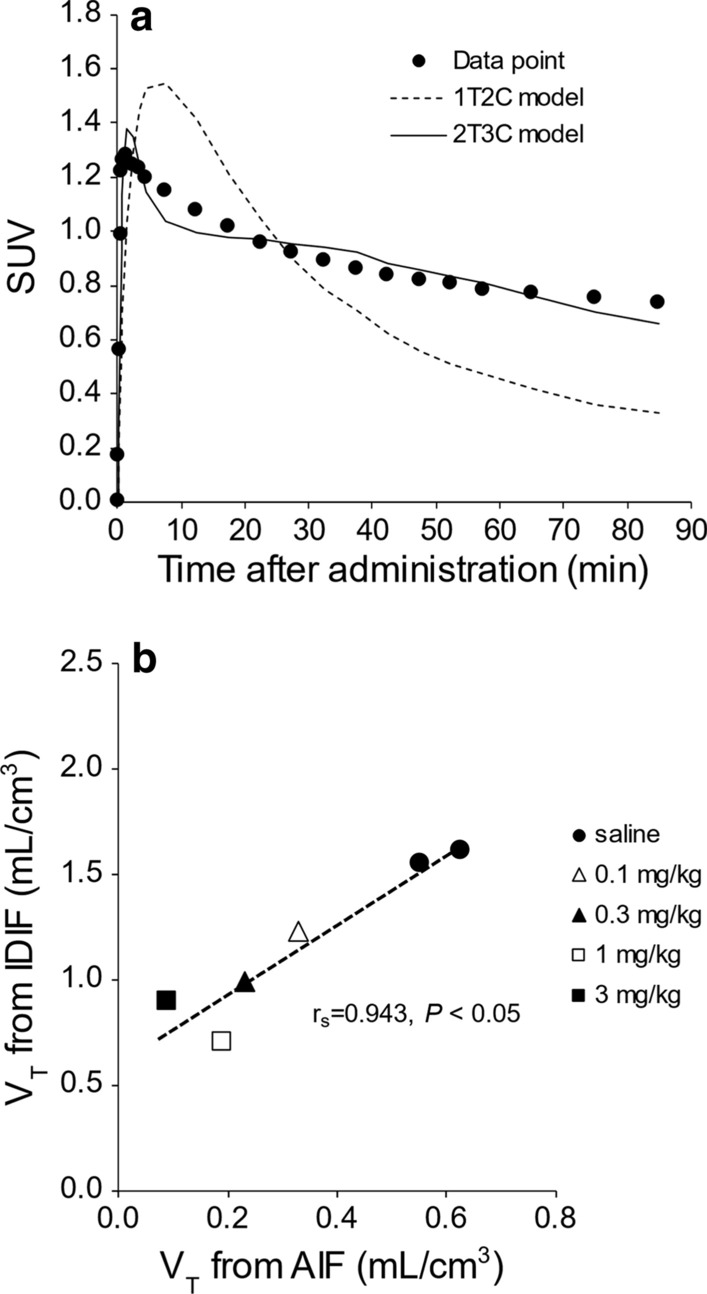
Fig. 5.

Curve fitting for the compartment analysis and correlation analysis with VT. a Quality of curve fitting for a representative hepatic time-activity curve and b correlation between VT obtained using IDIF and VT obtained using AIF. Saline or unlabelled RGD (0.1, 0.3, 1, or 3 mg/kg) were administered intravenously 5 min before 18F-FPP-RGD2. 1T2C model one-tissue two-compartment model, 2T3C model two-tissue three-compartment model, IDIF image-derived input function, AIF arterial input function
