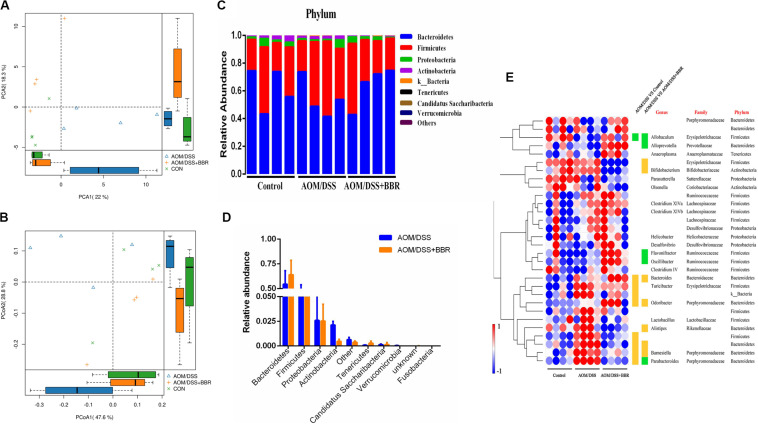
FIGURE 3.
Diversity and composition of gut microbiota among groups (n = 4/group). (A,B) unsupervised PCA scatter plot and weighted uniFrac-based PCoA of feces microbiota. (C) Bacterial taxonomic profiling at the phylum level in different sample. (D) Relative abundances of bacterial phyla level between AOM/DSS group and AOM/DSS + BBR group, and the red marked bacteria have significant differences; (E) Heat map of the relative abundances of various bacterial genera identified in feces samples among groups. Each raw represents one genus with its family and phylum information, and blank means unclassified. Each column represents an individual sample. Red or blue color represents the high relative or low relative of abundance in each sample. Besides, green or orange entry indicates genera that were averagely less or more abundant in AOM/DSS group relative to control group, or to AOM/DSS + BBR group, and there were significant differences between the two groups (P < 0.05).

