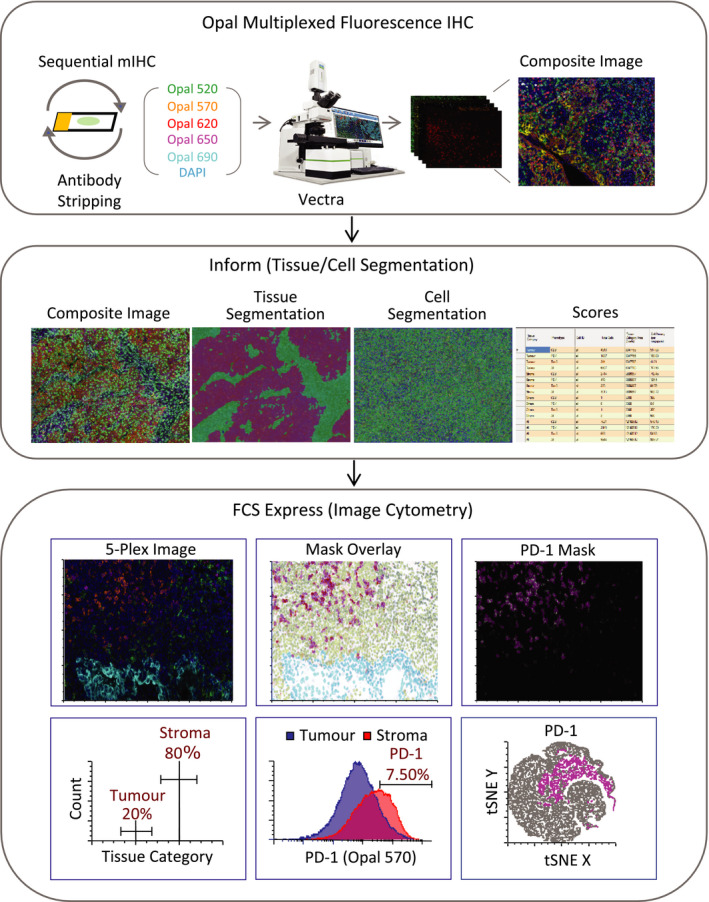
Figure 2.

Work flow and general framework for multiplexed image analysis using Vectra quantitative digital pathology system and FCS express (flow and imaging). Typical steps involved in the fluorescence image analysis: Opal multiplexed fluorescence IHC, Vectra image scanning, Inform (Unmixing, Tissue Segmentation, Cell Segmentation, score), FCS export and image cytometry [Top: Unmixed image (left), Picture plot (middle) showing mask overlays on PD‐1‐positive cells (magenta), stromal cells (green) and tumor cells (cyan), Picture plot highlighting PD‐1‐positive cells (right); Bottom: Histogram showing tissue category region gated for cells in tumor and stroma (left), Histogram overlays (middle) of PD‐1 expression on tumor and stroma quantified from merged image data (12 fields of view from same slide), tSNE map showing PD‐1 expression highlighted in magenta (right)].
