
Figure 3.
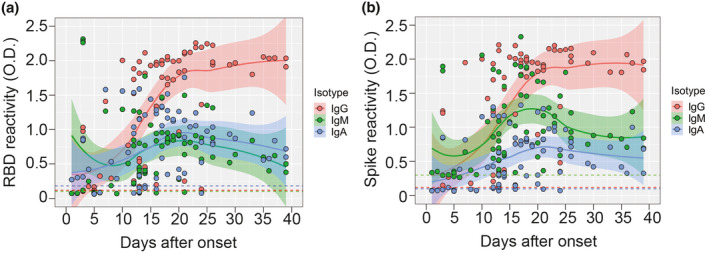
Antibody isotype usage during the response to SARS‐CoV‐2 RBD‐S and spike. (a) RBD‐S IgM, IgG and IgA in serum (diluted 1:50) were determined by ELISA and plotted against days post‐onset of symptoms (n = 77 samples). LOESS‐smoothed lines and 95% confidence intervals are shown for each isotype. (b) Spike‐reactive IgM, IgG and IgA in serum (diluted 1:100) were determined by ELISA and plotted against days post‐onset of symptoms. LOESS‐smoothed lines and 95% confidence intervals are shown for each isotype.