
Figure 4.
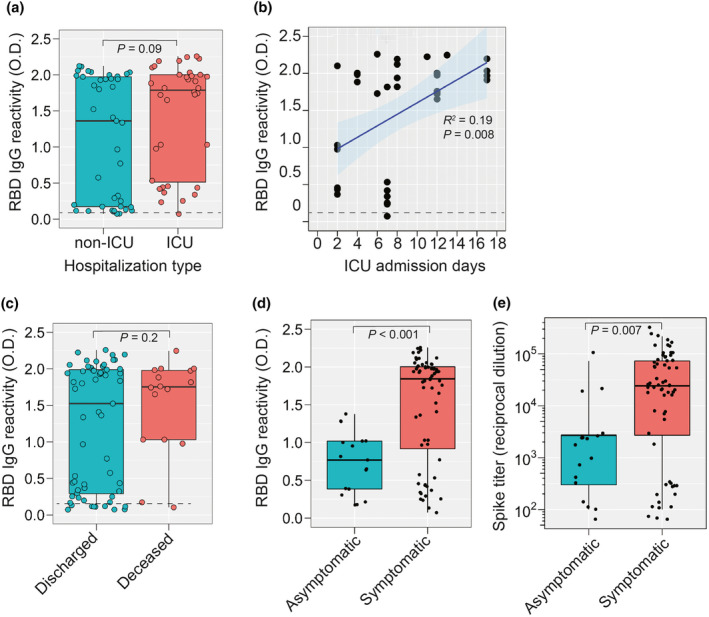
SARS‐CoV‐2 RBD‐S IgG responses during hospitalisation. (a) RBD‐S IgG in patients that were hospitalised in the ICU or not. (b) For ICU‐hospitalised patients, all RBD‐S IgG values are presented as a function of ICU admission days. Spearman's Rho coefficient (R 2), 95% confidence interval, and P‐value are shown. (c) RBD‐S IgG in patients that were deceased (n = 16 samples from seven patients) or discharged (n = 61 samples from 25 patients). (d) RBD‐S IgG reactivity and (e) anti‐S IgG titres in symptomatic COVID‐19 patients (n = 77 samples) versus convalescent seropositive COVID‐19‐exposed volunteers (n = 17). Boxplots in a, c–e show the median, 95% confidence level and all individual samples. The Student's t‐test P‐value is shown.