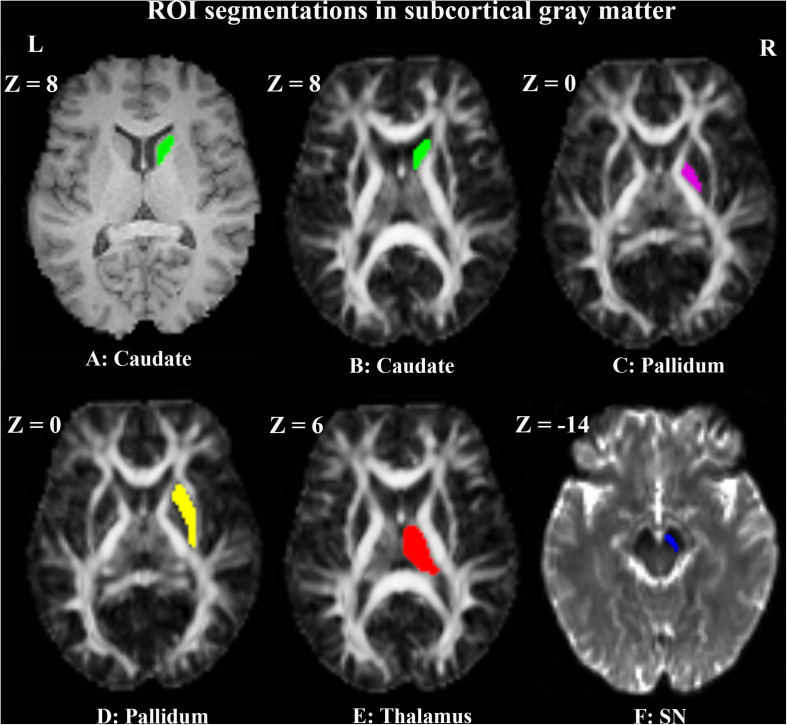
FIGURE 2.
Example of manual ROI segmentations in the right subcortical gray matter of a representative PD patient. The ROI of the right caudate is shown in green on T1WI (A) and FA map (B). The ROIs of right pallidum (C), putamen (D), and thalamus (E) are shown in violet, yellow and red on FA maps, respectively. The ROI of right SN (F) is shown in blue on the b0 map.

