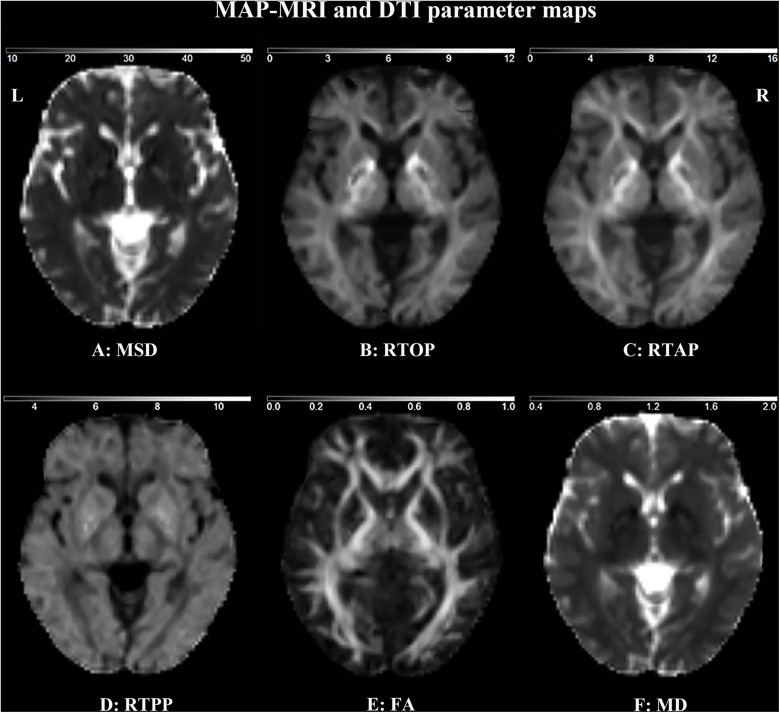
FIGURE 3.
MAP MRI and DTI parameter maps of a representative healthy subject. MSD (A), RTOP (B), RTAP (C) and RTPP (D) are derived from MAP MRI, and FA (E), and MD (F) are derived from DTI. FA is dimensionless; MD, MSD, RTOP, RTAP, and RTPP are expressed in 10–3 mm2 s–1, 10–5 mm2, 105 mm–3, 103 mm–2, and 101 mm–1, respectively.

