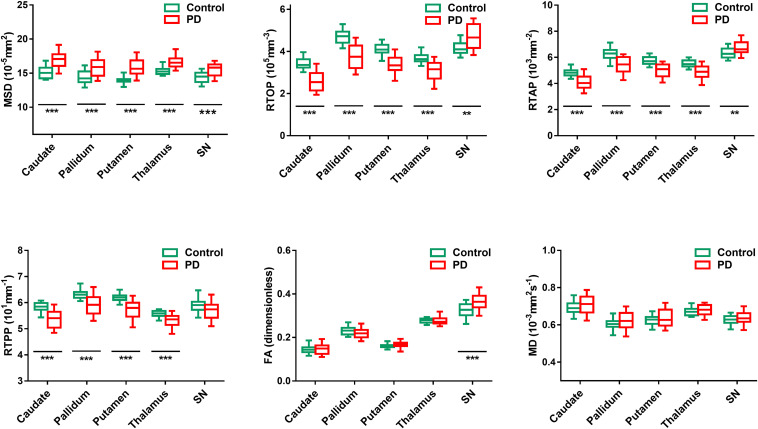
FIGURE 4.
Comparison of MAP MRI (MSD, RTOP, RTAP, and RTPP) and DTI (FA and MD) values between PD patients (red) and healthy controls (green) in the bilateral subcortical gray matter. Significant differences between PD patients and controls are represented as: *pFDR < 0.05, **pFDR < 0.01, ***pFDR < 0.001.

