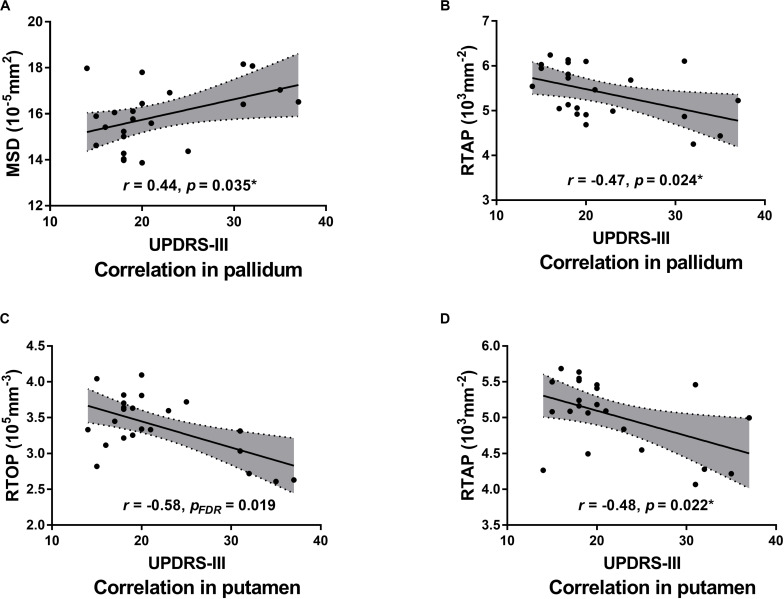
FIGURE 6.
Scatter plots of the significant correlations between MAP MRI measurements and UPDRS-III motor scores (“on” medication state) in the bilateral pallidum (A,B) and putamen (C,D). Pearson correlation coefficients and associated p-values are shown. The shaded areas represent the 95% confidence interval for each regression line. *Uncorrected.

