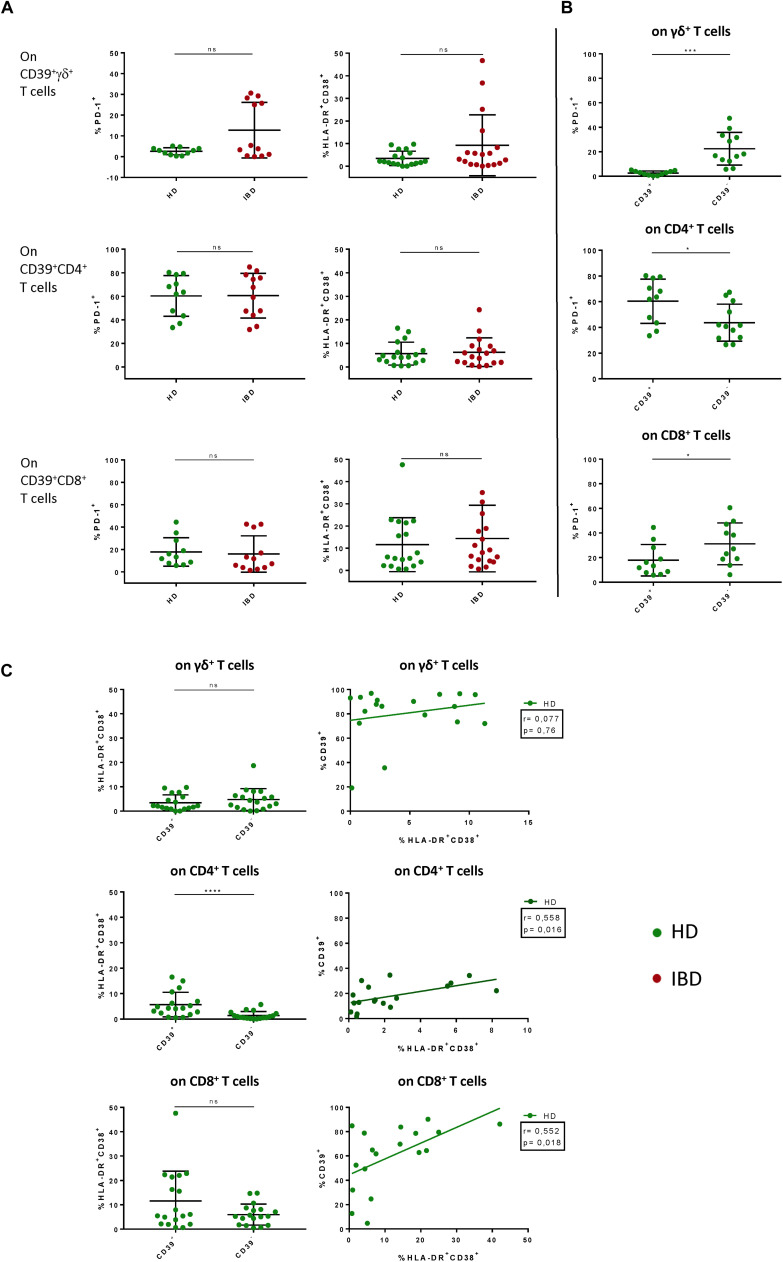
FIGURE 3.
Comparative analysis of PD-1, HLA-DR and CD38 on CD39+ γδ+, CD4+, and CD8+ T cells in LPL of HD versus IBD and CD39+ versus CD39– LPL in HD. (A) Comparison of the frequencies of PD-1+ and HLA-DR+ CD38+ CD39+ T cells between healthy donors (green shapes) and patients with IBD (red shapes). (B) Comparison of the frequencies of PD-1+ and HLA-DR+CD38+ cells between CD39+ and CD39– γδ+ T cells of healthy controls. (C) Correlation between frequencies of CD39+ and HLA-DR+CD38+ T cells. Spearman correlation analysis was applied. Data from LPL of healthy donors (n = 11/18) and IBD patients (n = 12/18), presented as means +/- standard deviation. ns ≥ 0,05, *p < 0.05, **p < 0.01, ***p < 0.001, ****p < 0.0001, as calculated by Mann–Whitney U test (A), Wilcoxon matched-pairs signed rank test (B) + (C), and Spearman correlation (C). HD, healthy donor; IBD, patient with inflammatory bowel disease; LPL, lamina propria lymphocytes.

