Figure 3.
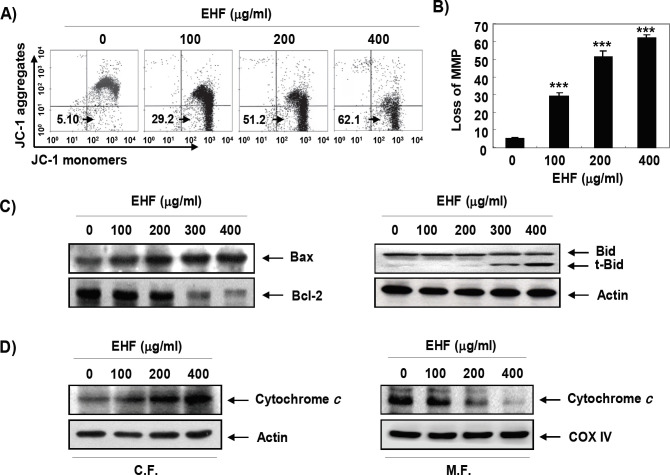
Induction of Mitochondrial Dysfunction and Cytosolic Release of Cytochrome c by EHF in B16F10 Cells. (A) After 48 h treatment with varying concentrations of EHF, the cells were stained with JC-1 dye and were then analyzed on a flow cytometer in order to evaluate the changes in MMP. (B) Data are expressed as mean ± SD (n=3). Statistical analyses were conducted using analysis of variance between groups (***P<0.0001 compared to control). (C) The cell lysates were prepared and the expression of Bcl-2 family proteins (Bcl-2, Bax and Bid) was evaluated by Western blot analysis with whole cell lysates. Equal protein loading was confirmed by an analysis of actin. (D) Cytosolic and mitochondrial proteins were prepared and analyzed for cytochrome c expression by Western blot analysis. Equal protein loading was confirmed by analysis of actin and cytochrome oxidase subunit VI (COX VI) in each protein extract. The results shown are representative of three independent experiments

