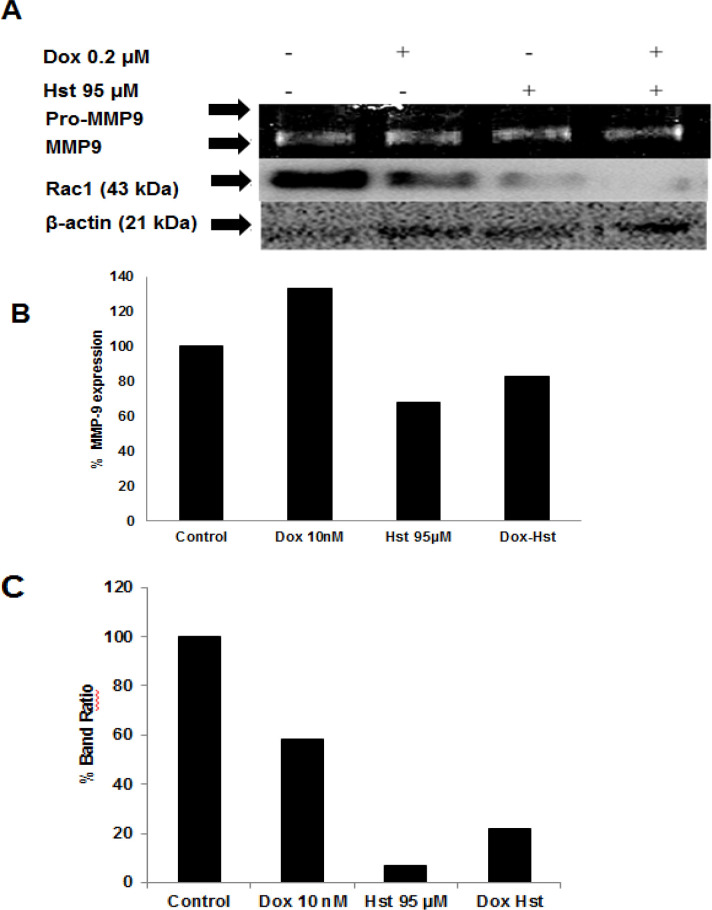
Figure 5.
Effect of Hst and Dox on Rac1 and MMP9 Expression. MMP9 expression was performed using gelatin zymography, meanwhile, Rac1 using western blot. (A), Band of Rac1 and MMP-9 after Hst, Dox, and combination treatment. The band was quantified using ImageJ software; (B), A percentage of MMP9 expression relative to control cells; (C), Percentage of Band Ratio of Rac1 between treatment and control cells

