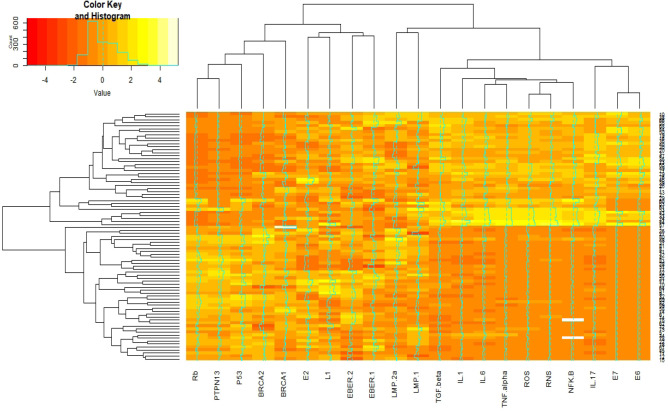
Figure 4.
Interactive Cluster Heatmap Displaying Similarity in Distributions of Cellular Signaling, Inflammatory, Human Papilloma virus (HPV), and Epstein-Barr virus (EBV)factors (as columns) in 83 breast cancer subjects (as rows). Rows and columns of the heatmap have been reordered according to a hierarchical clustering, represented by the dendrogram

