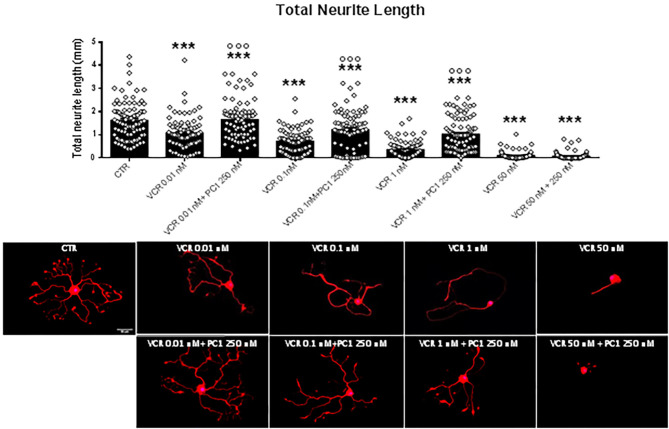
Figure 5.
Quantification of total neurite length of DRG primary sensory neurons, when the PK-Rs antagonist was in vitro administered in combination with different VCR nanomolar concentrations (0.01, 0.1, 1, and 50 nM). In the same figure are reported representative images of β3-tubulin (Tuj1; red) staining in DRG cell cultures. Cell nuclei were counterstained with DAPI (blue). Scale bar = 50 μm. Mean ± SEM, n ≥ 80 cells obtained from four independent experiments. One-way ANOVA followed by Bonferroni's post-test. ***p < 0.001 vs. CTR; °°°p < 0.001 vs. VCR relative dose.

