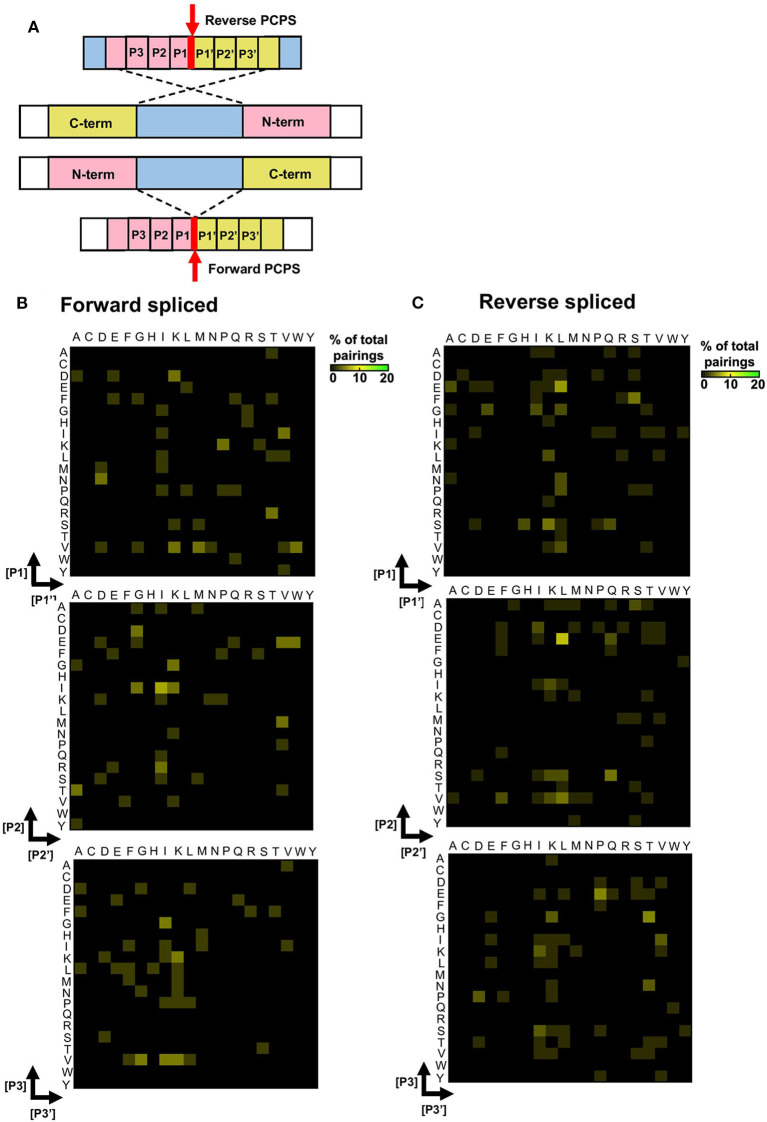
Figure 4.
Forward and reverse PCPS reactions display unique splice site signatures. (A) Schematic depicting forward and reverse PCPS. Red arrows indicate fusion sites. Amino acid pairings proximal to the fusion site are labeled P1/P1′, P2/P2′ and P3/P3′. (B) Forward PCPS splice site signature. (C) Reverse PCPS splice site signature. In (B) and (C), heat maps show frequencies of amino acid residue pairings at ±1, 2, or 3 aa adjacent to the fusion site. Scale represents the frequency of each amino acid pairing as a percentage of the overall pairings, and amino acids are defined using single letter code.

