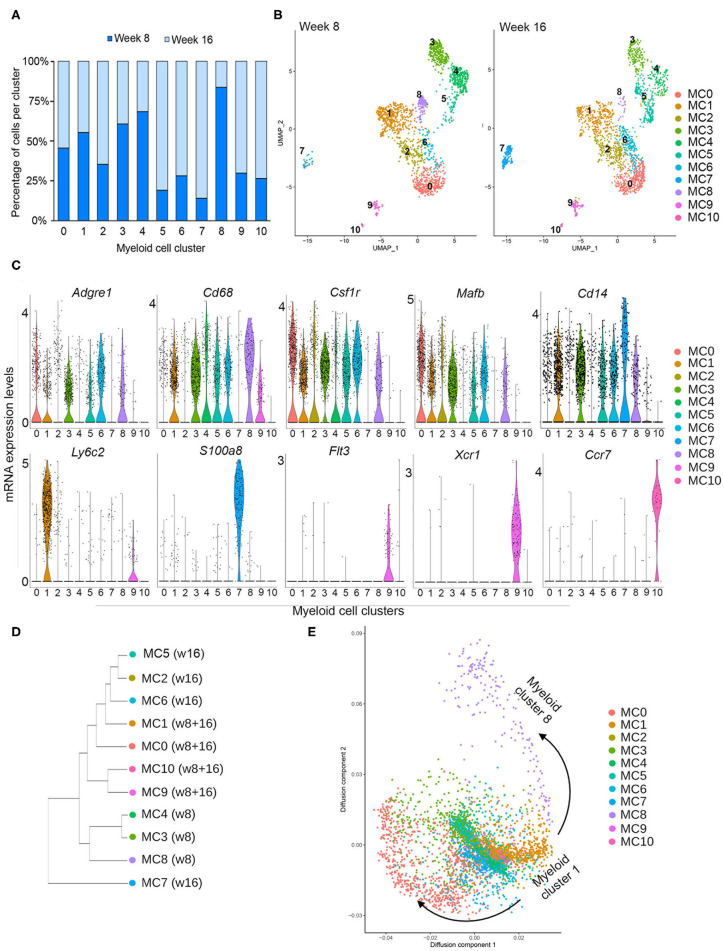
Figure 2.
Myeloid subclusters based on CD14 expression. (A) Graph depicts the number of cells in each myeloid cell cluster as a percentage at week 8 (dark blue) and week 16 (light blue). (B) UMAPs depict the distribution of CD14+ myeloid cells at week 8 (left) or week 16 (right), identifying 11 distinct myeloid clusters (MC 0–10) and their abundance at each timepoint. (C) Violin plots demonstrate the distribution of various genes in each myeloid cluster that are commonly expressed in macrophages (Adgre1, Cd68, Csfr1, Mafb, Cd14), monocytes (Ly6c2), other myeloid cells (S100a8), and dendritic cells (Flt3, Xcr1, Ccr7). (D) Dendrogram shows similarities among subclusters and enrichment for each cluster at week 8 or week 16. (E) Diffusion map for myeloid subclusters demonstrating a branch point at cluster 1, which represents Ly6c2+ monocytes.

