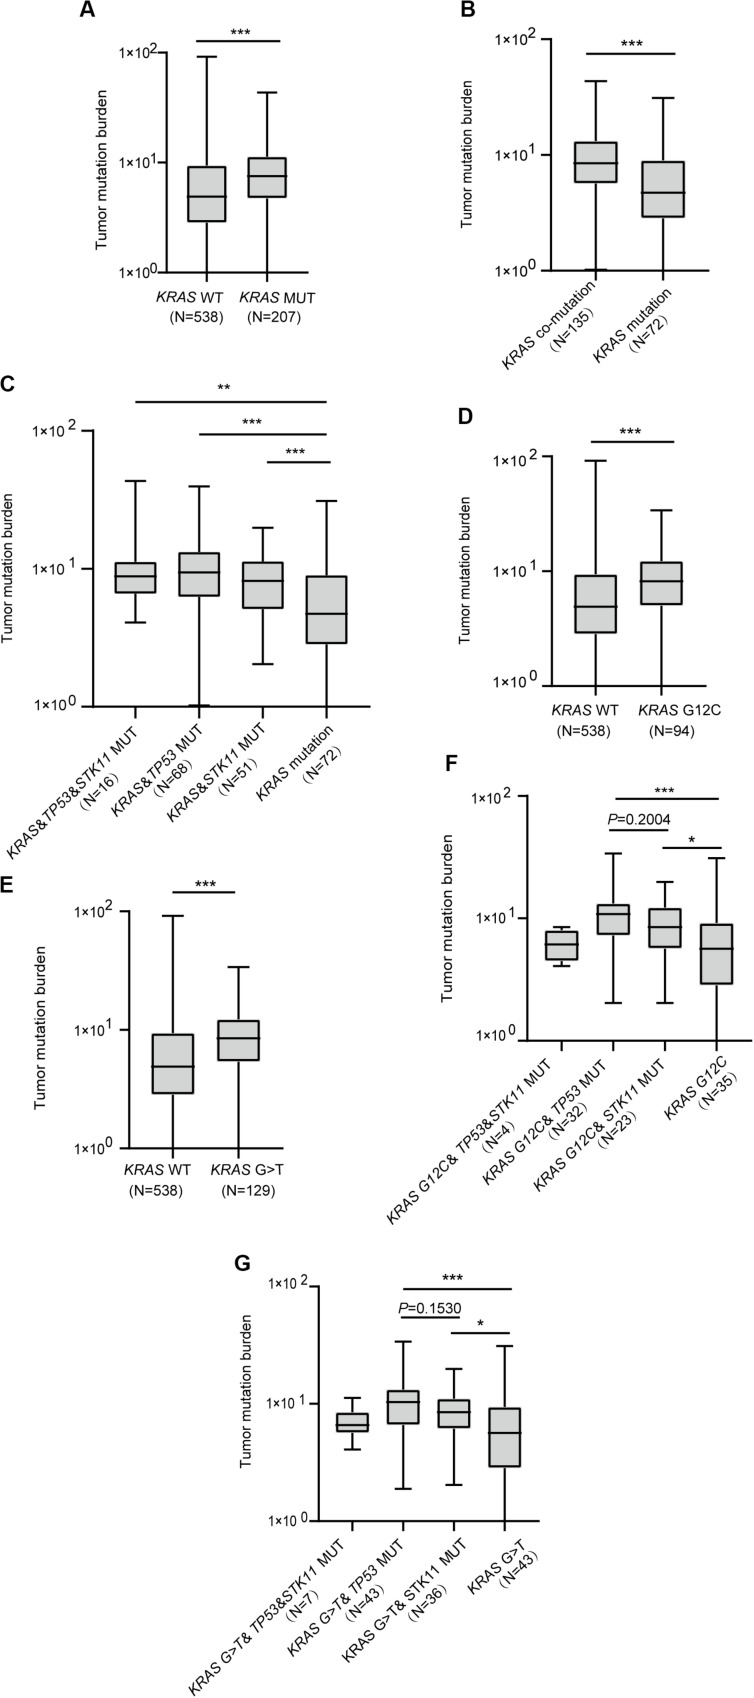
FIGURE 3.
The correlation between KRAS mutational status and tumor mutation burden. (A) Patients with KRAS mutation have greater tumor mutation burden. (B) Patients with KRAS mutation and concurrent mutations have greater tumor mutation burden than those with KRAS mutation alone. (C) Comparison of tumor mutation burden in KRAS co-mutation subtypes. (D,E) Comparison of tumor mutation burden in KRAS G12C (D) and G > T (E) subtypes. (F,G) Comparison of tumor mutation burden in G12C (F) and G > T (G) subtypes with co-mutations. MUT, mutant; WT, wild-type. Box plot data are presented as mean, interquartile ranges, and ranges. ***P < 0.001; **P < 0.01; *P < 0.05.

