FIGURE 5.

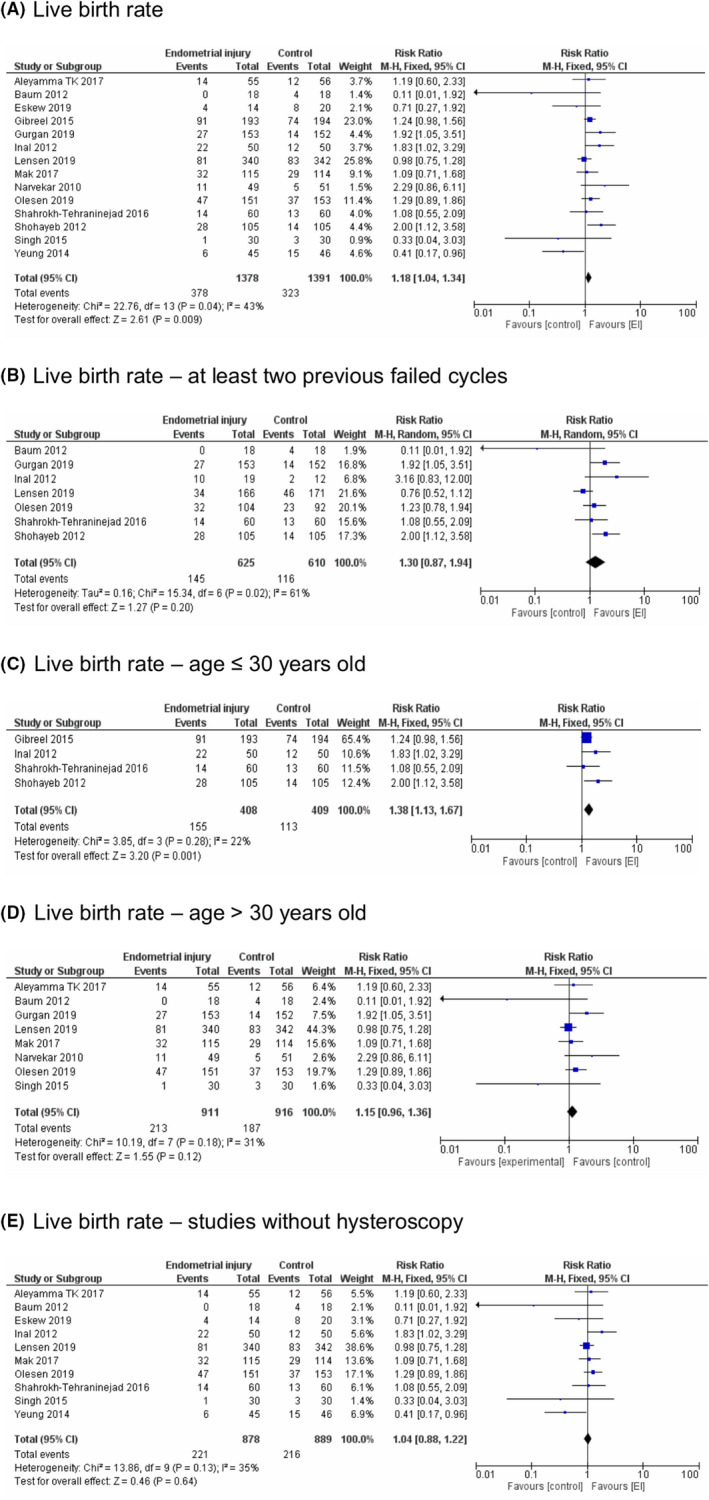
Live birth rate—Forest plots. A, Live birth rate. B, Live birth rate—at least two previous failed cycles. C, Live birth rate—age ≤ 30 years old. D, Live birth rate—age > 30 years old. E, Live birth rate—studies without hysteroscopy

Live birth rate—Forest plots. A, Live birth rate. B, Live birth rate—at least two previous failed cycles. C, Live birth rate—age ≤ 30 years old. D, Live birth rate—age > 30 years old. E, Live birth rate—studies without hysteroscopy