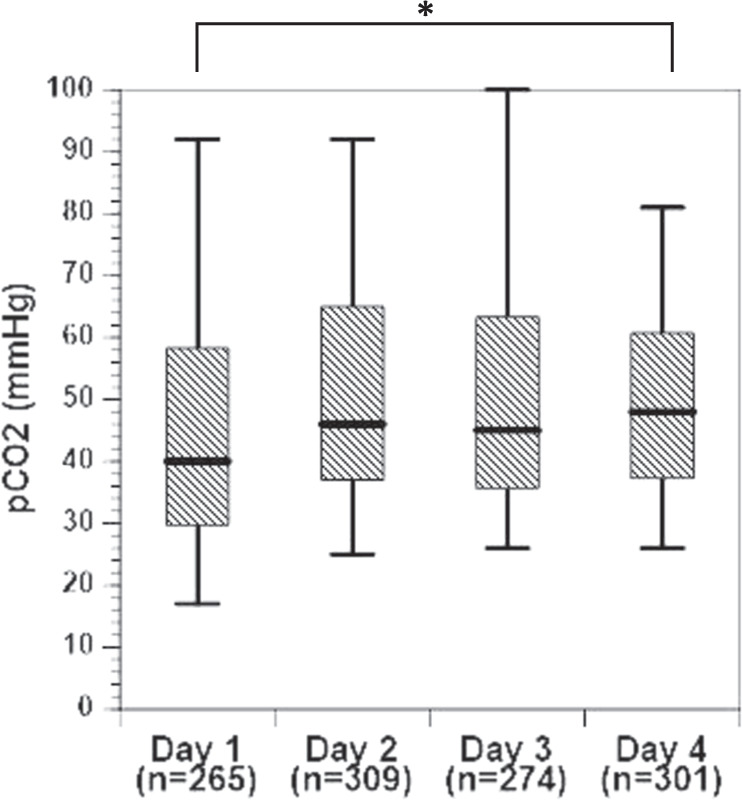
Fig. 2. Boxplot of the median, IQR, and range (black line, hashed box, and wiskers) CO2 by postnatal day.

Asterisk (*) denotes a significant difference between postnatal days 1 and 4, p < 0.0001.

Asterisk (*) denotes a significant difference between postnatal days 1 and 4, p < 0.0001.