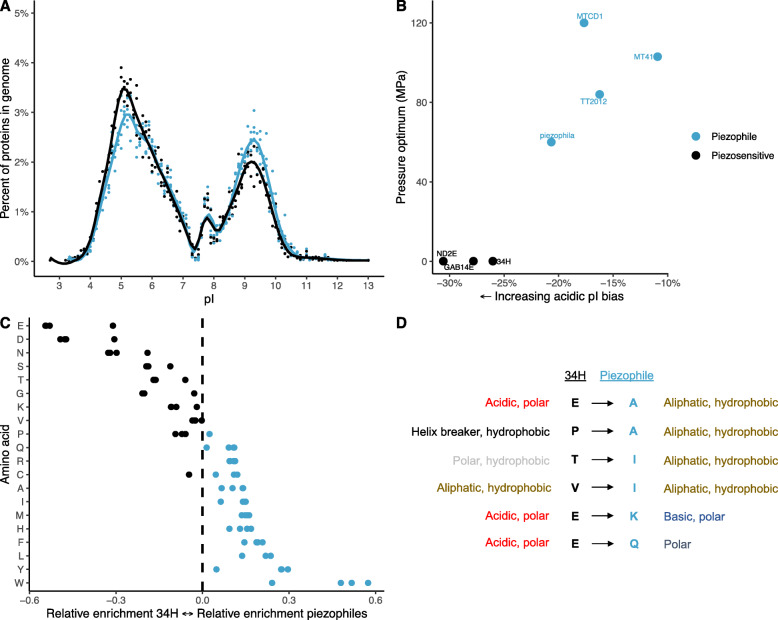
Fig. 2.
a; Isoelectric point distribution of proteins within piezophilic (blue points) or piezosensitive (black) strains, with an average line of fit within each group. b; Isoelectric point protein bias within each strain as a function of their growth pressure. c; Asymmetry index values indicating preference of amino acids in the piezophiles or C. psychrerythraea 34H within orthologous proteins present in all strains. d; Specific amino acid substitutions from C. psychrerythraea 34H to the piezophiles within orthologous proteins. The substitutions shown were also identified within comparisons between piezophilic and piezosensitive Shewanella

