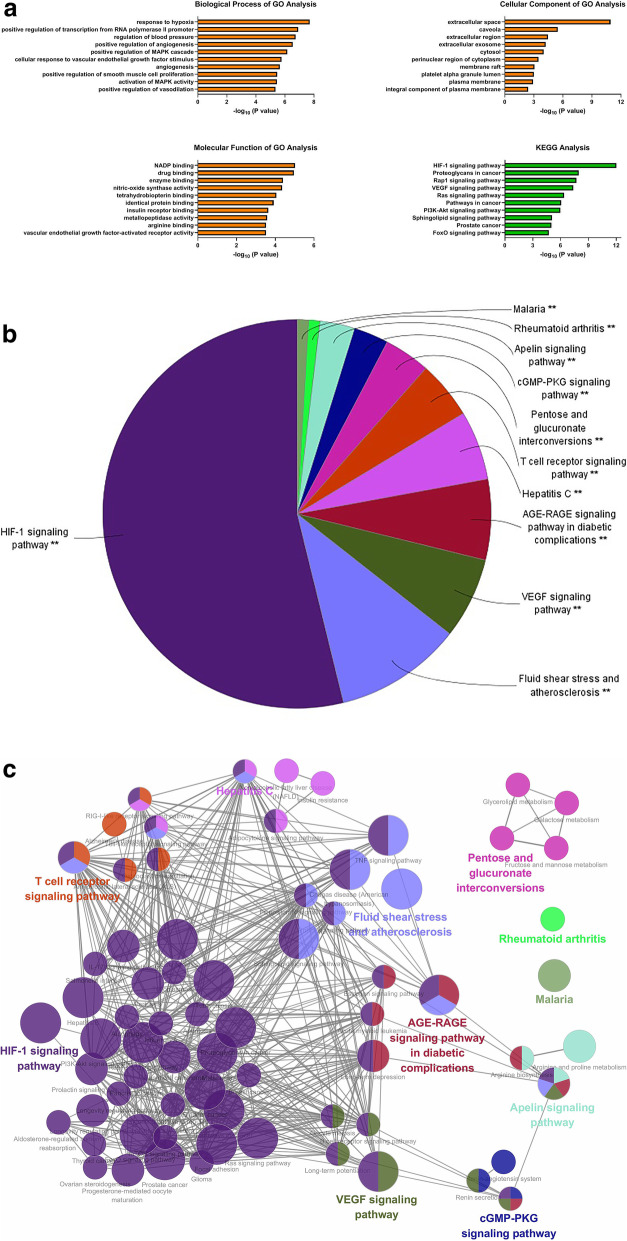
Fig. 4.
Functional enrichment of GO terms and KEGG pathways from DAVID and ClueGo. a GO terms and KEGG pathways from DAVID. b The pie chart from ClueGo. It shows the enriched signaling pathway categories based on the kappa coefficient, including HIF-1 signaling pathway, fluid shear stress and atherosclerosis, VEGF signaling pathway, AGE-RAGE signaling pathway in diabetic complications, hepatitis C, T cell receptor signaling pathway, pentose and glucoronate interconversions, cGMP-PKG signaling pathway, apelin signaling pathway, rheumatoid arthritis, and malaria. c The functional enrichment network from ClueGo. The node represents the signaling pathway, and the size of each node represents the enrichment significance of each signaling pathway. The larger the node is, the more significant the pathway is. The line represents the correlation between functions, and the thickness of each line represents the kappa coefficient between functions. The thicker the line is, the greater the kappa coefficient is

