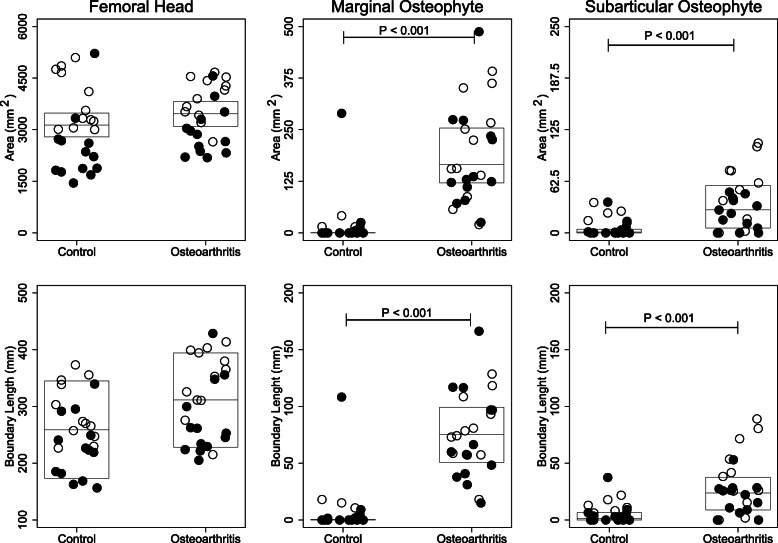
Fig. 2.
Femoral Head: Each open/black dot represents the total area or boundary length of the femoral heads for a male/female subject. The horizontal line indicates the mean of the control group and the patients with osteoarthritis, while the boxes represent the 95% confidence interval. Student’s t-test was used to test for statistical significance. Marginal- and Subarticular osteophytes: Each open/black dot represents the total area or boundary length of marginal- or subarticular osteophytes for a male/female subject. The horizontal line indicates the median of the control group and the patients with osteoarthritis, while the boxes represent the interquartile range. Mann–Whitney U test was used to test for statistical significance. P-value < 0.05 was considered significant

