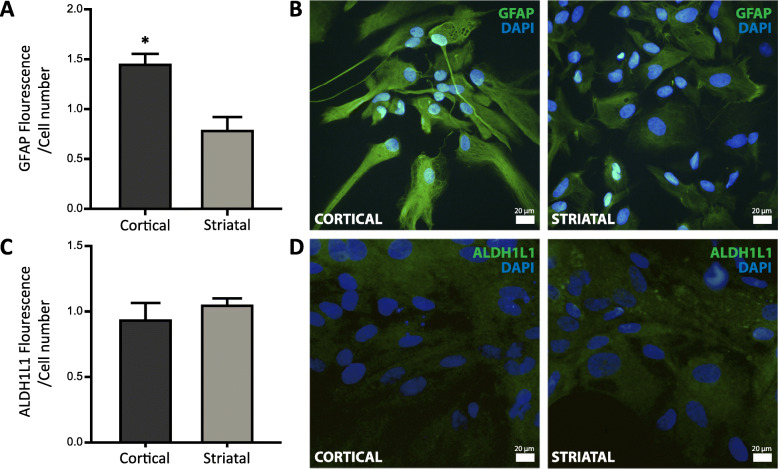
Fig. 1.
Characterization of region-specific astrocytes. a GFAP expression in cortical and striatal astrocytes was assessed by immunocytochemistry and normalized to the number of cells. Values represent the mean ± SEM of n = 3 independent experiments of GFAP fluorescence/cell determined by ImageJ software. Differences between two groups were analyzed by Student’s t test (**p < 0.01 vs. striatal astrocytes). b Representative merged images showing in green GFAP-positive cortical (left) and striatal (right) astrocytes and in blue their nuclei stained with DAPI. c ALDH1L1 expression in cortical and striatal astrocytes was assessed by immunocytochemistry and normalized to the number of cells. Values represent the mean ± SEM of n = 3 independent experiments of ALDH1L1 fluorescence/cell determined by ImageJ software. Differences between two groups were analyzed by Student’s t test. d Representative merged images showing in green cortical (left) and striatal (right) astrocytes positive for ALDH1L1 and in blue their nuclei stained with DAPI

