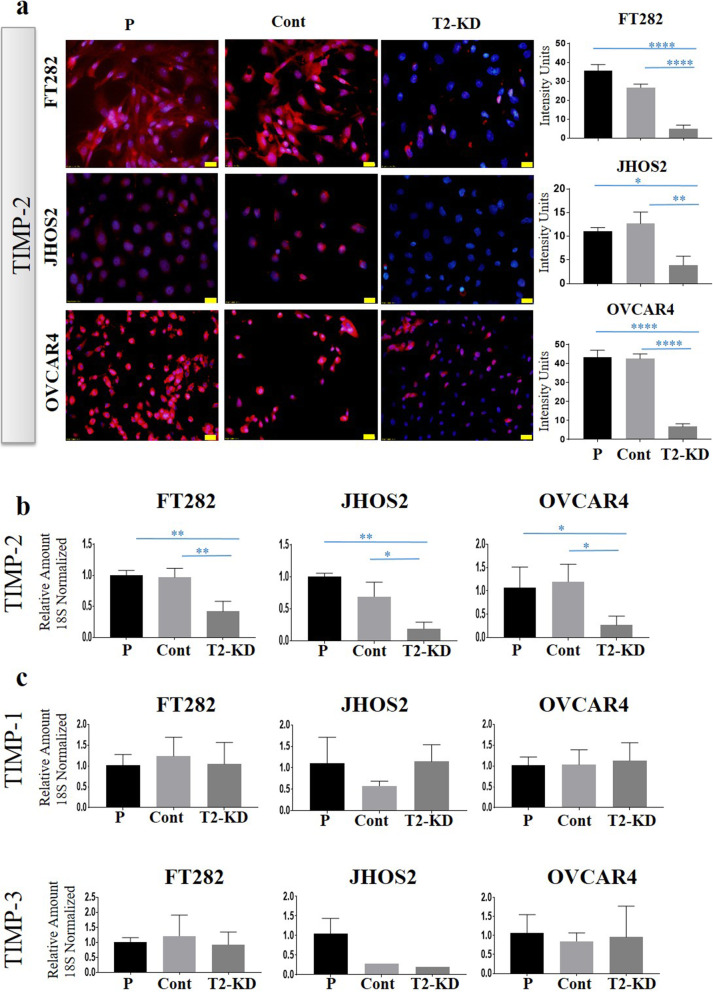
Fig. 3.
Reduction of TIMP-2 expression by siRNA: TIMP-2 expression knock down by siRNA transfection in FT282 (FT) and two ovarian cancer cell lines JHOS2 (JH) and OVCAR4 (OV) is described in the Methods. T2 is representative of a pool of all three TIMP-2 siRNAs at a 3 nM final concentration. a The expression of TIMP-2 at the protein level was deduced by immunofluorescence as described in Methods. Images are representation of merged DAPI (blue) and TIMP-2 (red) staining on individual cell line done in three passages in triplicate. The intensity of fluorescence was obtained using FIJI software. 20X magnification; scale bar (in yellow) 20 μM. P indicates parental cell line treated with transfection reagent, Cont are cells transfected with scrambled siRNA and T2-KD are TIMP-2 siRNA knock down cells. b mRNA expression of TIMP-2, (c) TIMP-1, and TIMP-3 was deduced after siRNA transfection in the representative cell lines by qRT-PCR as described in Methods. Graphs represents amount of mRNA relative to 18S + SEM derived from three experiments done in triplicate. Significance is determined by one-way ANOVA and indicated by *p < 0.05, **p < 0.01

