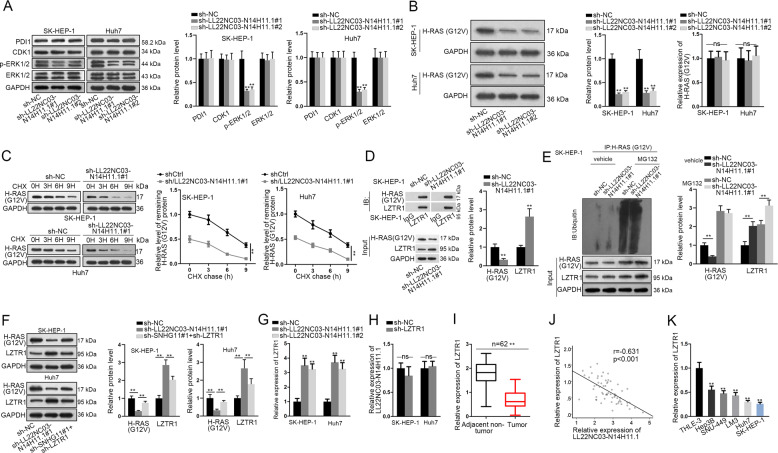
Fig. 4. LL22NC03-N14H11.1 inhibited H-RAS (G12V) ubiquitination by inhibiting LZTR1.
a Western blot results of PDI1, CDK1, p-ERK1/2, and total ERK1/2 in HCC cells under LL22NC03-N14H11.1 silence. b Western blot and RT-qPCR detected the expression of H-RAS (G12V) in Huh7 and SK-HEP-1 cells under LL22NC03-N14H11.1 silence. c Cycloheximide (CHX) was added to inhibit protein generation. Protein level of H-RAS (G12V) in SK-HEP-1 and Huh7 cells under LL22NC03-N14H11.1 silence was detected by western blot and quantified at 0, 3, 6, and 9 h after CHX treatment. d CoIP followed by western blot analyzed the levels of H-RAS (G12V) and LZTR1 in the binding complex of LZTR1 and control IgG, as well as their levels in input. e CoIP assay determined the ubiquitination level of H-RAS (G12V) in SK-HEP-1 cells under LL22NC03-N14H11.1 silence with or without MG132 treatment, and the level of input H-RAS (G12V) and LZTR1 was also detected via western blot. f Western blots of H-RAS (G12V) and LZTR1 in HCC cells under LL22NC03-N14H11.1 silence. g RT-qPCR analysis of LZTR1 level in HCC cells under LL22NC03-N14H11.1 silence. h RT-qPCR analysis of LL22NC03-N14H11.1 level in HCC cells under LZTR1 silence. i RT-qPCR analysis of LZTR1 level in 62 pairs of HCC tissues and matched non-tumorous tissues. j Negative correlation between LZTR1 and LL22NC03-N14H11.1 in HCC tissues was confirmed by Pearson’s correlation curve. k RT-qPCR analysis of LZTR1 in HCC cell lines vs. normal cell line. **P < 0.01; n.s. no significance.

