
Figure 3.
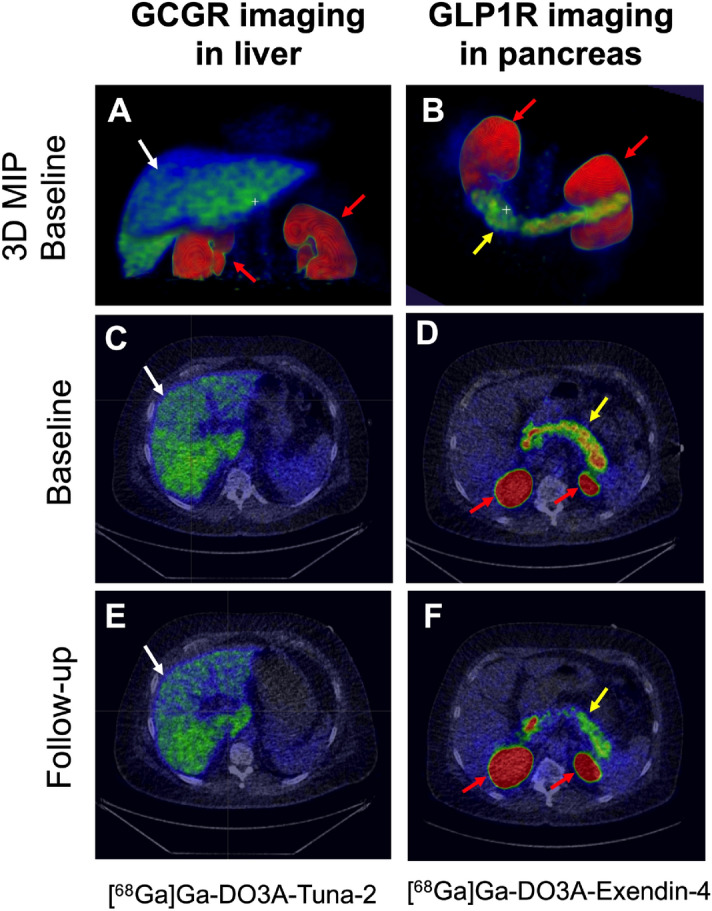
Representative images (A, B: 3D Maximal Intensity Projections (MIP) and C–F: trans-axial projection) of PET uptake for the tracer for the GCGR (left panels, A, C, E) and GLP1R (right panels, B, D, F). [68Ga]Ga-DO3A-Tuna-2 displayed strong binding in the liver which is rich in GCGR combined with low or negligible uptake in surrounding GCGR negative tissues (A, C). [68Ga]Ga-DO3A-Exendin-4 on the other hand showed strong binding to GLP1R in pancreas at baseline (B, D). Both PET tracers were excreted through renal route and trapped in the kidney cortex. The reduction in binding at the follow up examinations following treatment are proportional to the SAR425899 drug occupancy at the respective receptor (E, F). The baseline and follow-up images for the respective tracers are normalized to SUV = 5 and are directly comparable. White arrows indicate liver, yellow arrows indicate pancreas and red arrows indicate kidneys.