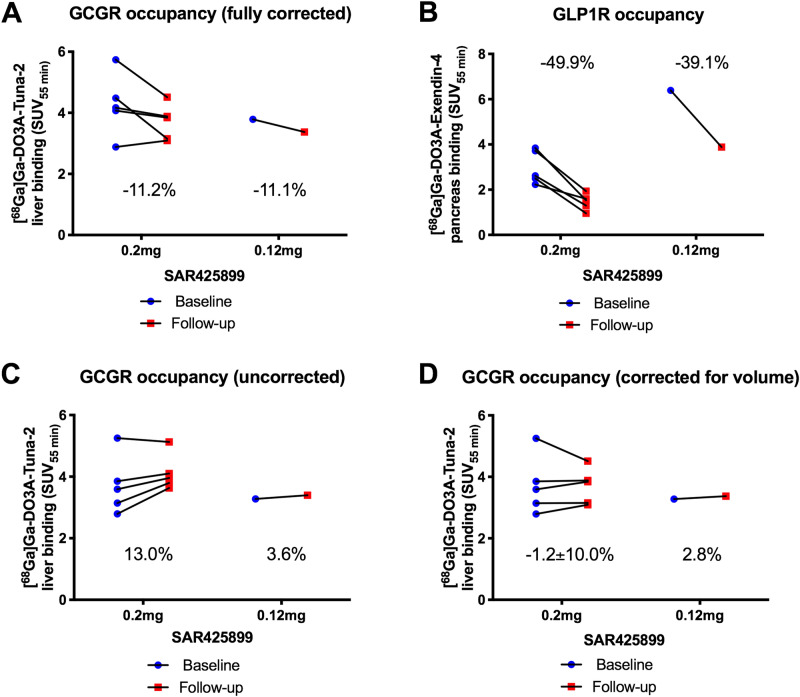
Figure 4.
Results of the PET assessments. Blue circles represent baseline PET examinations and red squares represent follow-up PET examinations on treatment with 0.2 or 0.12 mg SAR425899. Liver binding of [68Ga]Ga-DO3A-Tuna-2, corrected for plasma glucagon levels and decrease in liver volume, at baseline and on SAR425899 treatment (A). [68Ga]Ga-DO3A-Exendin-4 binding in pancreas at baseline and follow-up (B). The uncorrected [68Ga]Ga-DO3A-Tuna-2 liver binding (C) and following correction only for the change in liver volume (D) is also shown for clarity of the analysis. Percentages indicate change in binding, i.e. occupancy of SAR425899 treatment compared to baseline.

