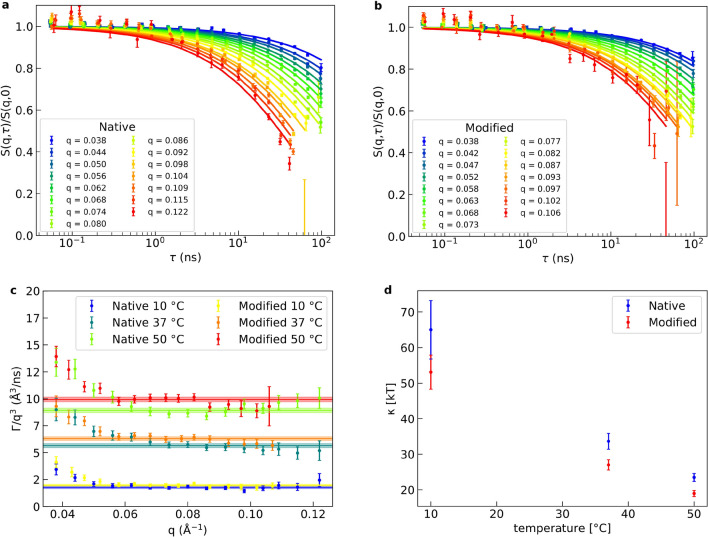
Figure 5.
Dynamics of LUV bending fluctuations measured by NSE and determination of bending rigidity. NSE data of (a) native and (b) EAE modified liposomes at 50C. The solid lines of the respective color show the respective fit with Zilman-Granek + center of mass diffusion model for each q-value. In (c) the fit parameter is plotted against q and fitted with a constant for each temperature and composition. The fit is indicated as a solid line in the respective color and its standard error by the thickness of the slightly transparent enveloping lines. In (d) the bending rigidity calculated of the fit values is plotted over the temperature for native and EAE modified lipid composition.

