Figure 1.
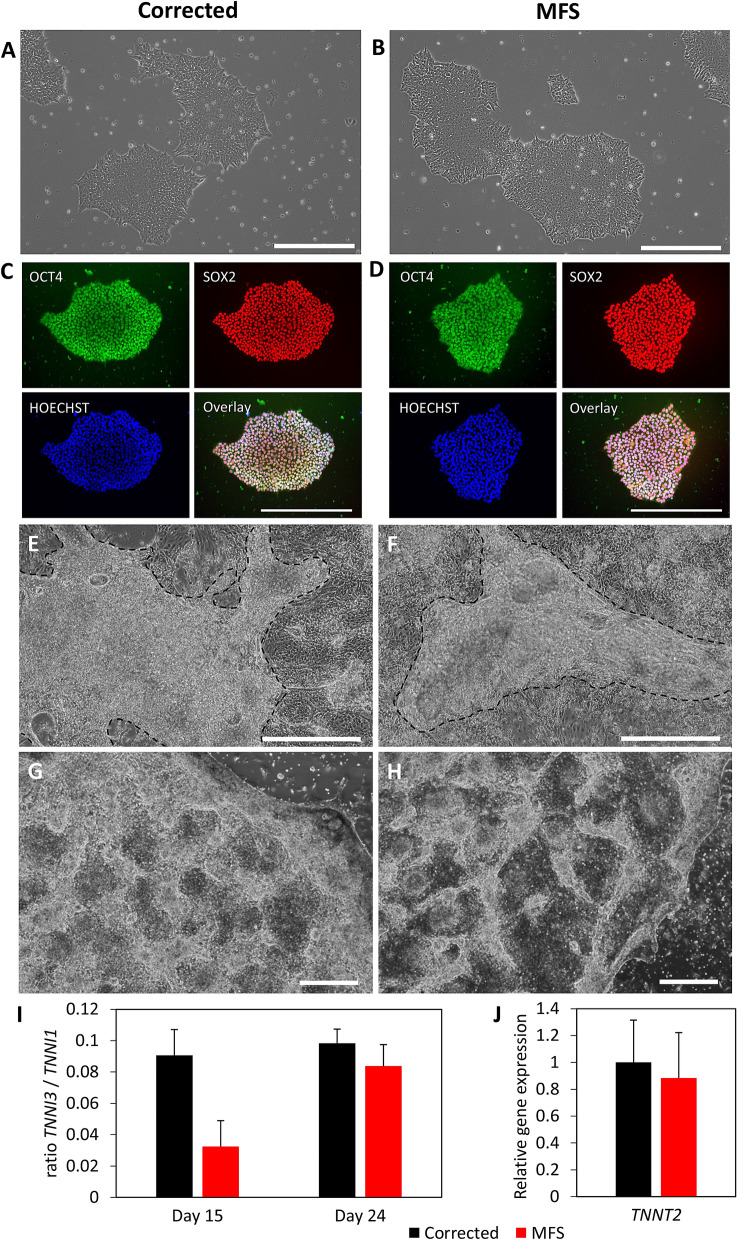
Phase contrast or immunofluorescent pictures from cell cultures of corrected (A,C,E,G) and MFS (B,D,F,H). hiPSC cultures have similar growth characteristics (A,B) and show expression of pluripotency markers OCT4 (green) and SOX2 (red) and HOECHST (blue) (C,D). Both CMs from corrected and MFS are growing as a layer on top of a basal layer of cells (E,F). The area of CMs in (E) and (F) is highlighted by the dashed line. Passaged CMs show better recovery in corrected (G) compared to MFS CMs (H) as indicated by the more brighter areas in corrected CMs. Scalebars indicate 500 µm. Graph (I) shows the ratio between TNNI3 and TNNI1 as a ratiometric marker for maturation of the CMs at day 15 and day 24, n = 3. Graph (J) represents the relative gene expression for TNNT2 in the cardiac model at day 24 for corrected (black) and MFS (red), n = 6.

