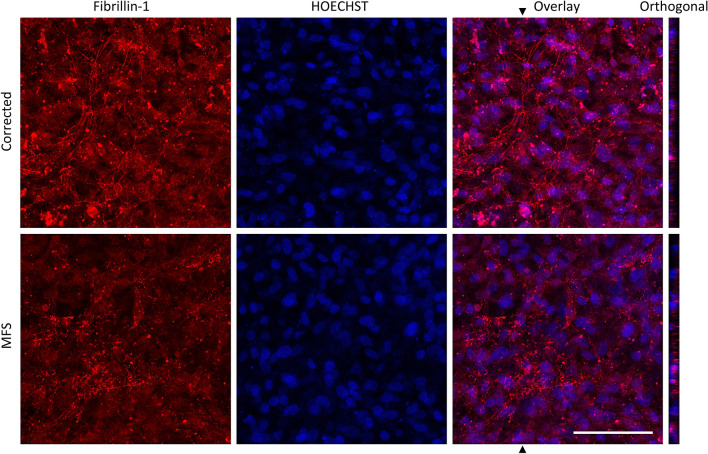
Figure 2.
Immunohistochemical staining for fibrillin-1 on CM cell culture for corrected and MFS. Fibrillin-1 in red and nuclei stained with HOECHST in blue after 25 days after the start of cardiac differentiation. Fibrillin-1 microfibrils or punctate assemblies are observed in corrected or MFS cultures, respectively. The average fluorescent intensity of fibrillin-1 in this image is respectively 26.65 and 19.51 for corrected and MFS cell culture. Orthogonal view shows the z-section of the area, indicated with the arrow in the overlay image. Bar indicates 100 µm.

