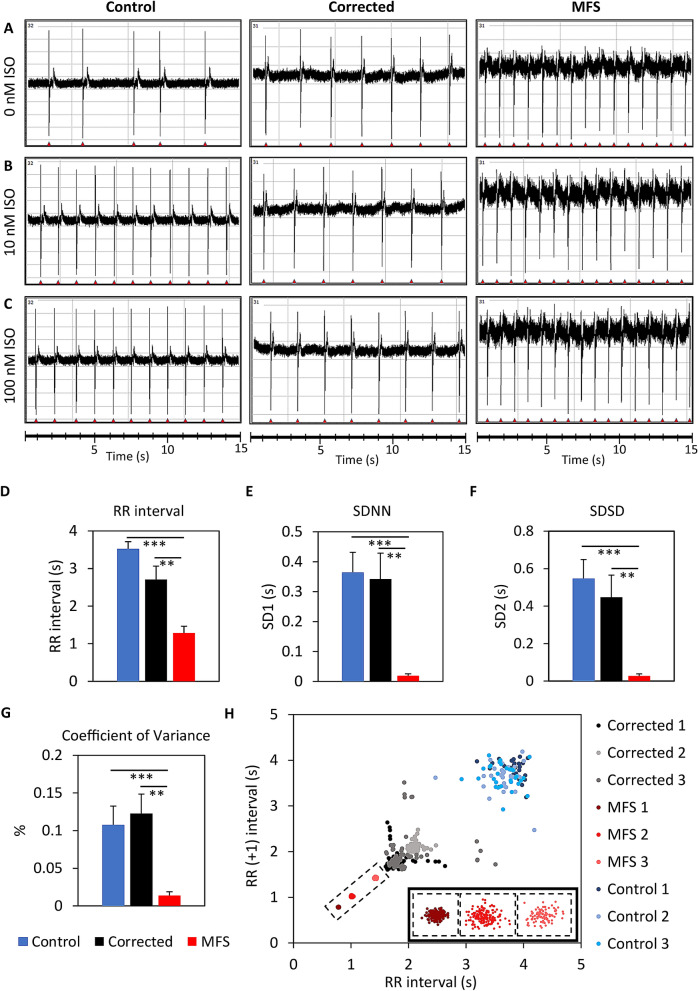
Figure 5.
MEA measurements of the extracellular field potentials for the control line (H9), the corrected CMs and the MFS CMs after 20–25 days after start of cardiac differentiation. (A) The baseline measurements without the addition of isoproterenol (ISO). The extracellular field potentials are shown for 10 nM (B) and 100 nM ISO (C). The bar plots show the differences between control, corrected and MFS CMs for RR interval (D), SDNN (E), SDSD (F) and coefficient of variance (G). Corrected CMs (n = 9, black), MFS CMs (n = 8, red). Poincaré plot from three representative replicates of the control (blue), corrected (black) and MFS CMs (red) (H). The three clusters of MFS are magnified in the right corner of figure (H). The level of significance is indicated by asterisks: p values less than 0.001 are indicated with three asterisks and p values less than 0.01 indicated with two asterisks.

