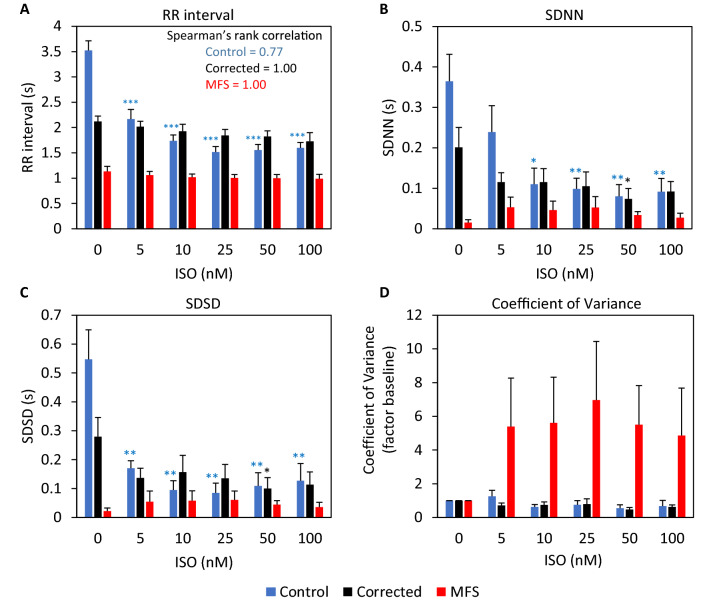
Figure 6.
MEA measurements of control, corrected and MFS CMs after treatment with serial isoproterenol (ISO) concentrations of 5, 10, 25, 50 and 100 nM. Bar plots show differences between the three lines at each ISO concentration for RR interval (A), SDNN (B), SDSD (C) and the coefficient of variance presented as factor of the baseline (D). The Spearman’s rank correlation is indicated in panel A. Corrected CMs (n = 6, black), MFS CMs (n = 7, red), H9 control (n = 5, blue).

