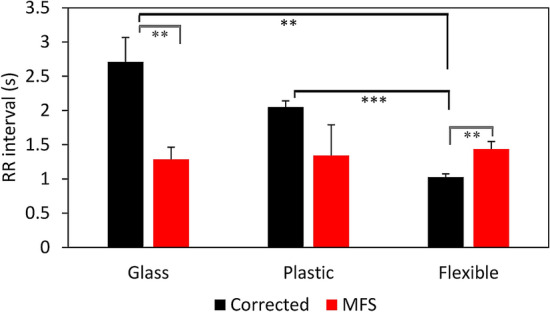
Figure 9.

RR interval of corrected (black) and MFS (red) CMs measured on different substrate stiffnesses: glass (≈10 GPa) n = 8, plastic (≈0.1 GPa) n = 3 and on a flexible Flexcell membrane (≈150 kPa) n = 6. Error bars represent the standard error in the bar graphs. The level of significance is indicated by asterisks: p values less than 0.001 are indicated with three asterisks and p values less than 0.01 indicated with two asterisks.
