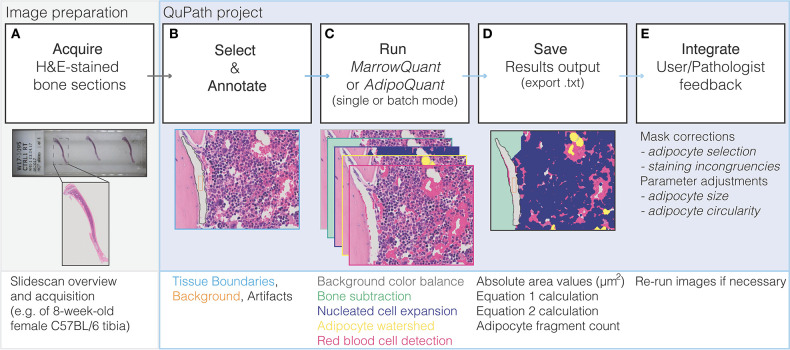
Figure 3.
Flow diagram of MarrowQuant logic. (A) A slidescan is acquired of an H&E stained bone section and loaded into QuPath. (B) User defines Tissue Boundaries, Background, and Artifacts with the help of the magic wand tool. (C) MarrowQuant is run on the created qProject in single or batch mode with preset or user-adjusted parameters. (D) Results can be saved as bone marrow mask images and a.txt file of area and calculated outputs. (E) User and/or pathologists' feedback is integrated by removing false-positive adipocyte selection and if necessary, processing images with adjusted adipocyte parameters.

