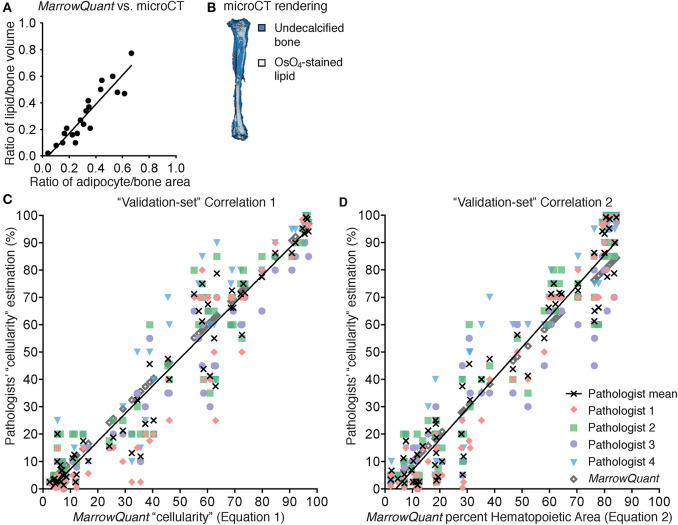
Figure 4.
Correlation to gold standards for MarrowQuant bone marrow adiposity and hematopoietic cellularity measurements. (A) MarrowQuant adipose area vs. osmium-tetroxide contrast-enhanced CT measurements of lipid (n = 23 bones, R2 = 0.84). Quantifications performed on femurs and tibiae of 18-months-old male mice, 8-weeks, 9-months, or 18-months-old female mice and of a select ion from (C). (B) μCT rendering (white: osmium-tetroxide stained lipids; blue: undecalcified bone) of a tibia from an 18-months-old C57BL/6 female mouse. (C) MarrowQuant “cellularity” (Equation 1) vs. Pathologists' “cellularity” assessment on the “validation-set” of images of full-length bones (Pathologists n = 4, images n = 59, R2 = 0.93). (D) MarrowQuant percent Hematopoietic Area (Equation 2) vs. Pathologists' “cellularity” assessment of the “validation-set” (Pathologists n = 4, images n = 59, R2 = 0.93). Evaluations done for femurs and tibiae of 2-months-old female mice at 0–42 days post lethal irradiation and transplant of 125,000 total bone marrow cells. All mice were C57BL/6 housed at room temperature and fed a standard ad libitum chow diet. OsO4, osmium tetroxide; μCT, micro-computerized tomography.

