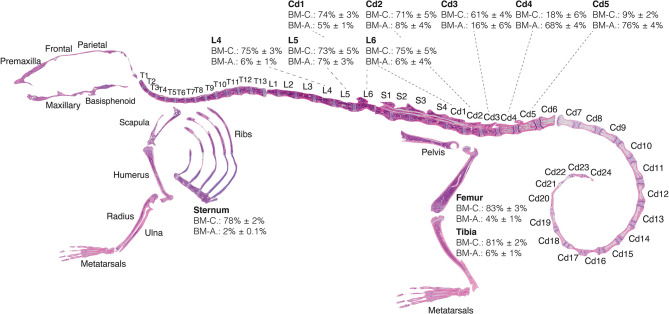
Figure 5.
Red-to-yellow marrow transition in homeostasis. Eight-weeks old C57BL/6 reconstructed skeletal map locates the proximal-to-distal red-to-yellow marrow transition in the first caudal vertebrae and proximal-to-distal tibia approximately at the site of the fibular insertion. Skeletal map and quantifications performed for bones of female mice housed at room temperature and fed a standard ad libitum chow diet. Percentages of MarrowQuant cellularity (BM-C) and adiposity (BM-A) from Equation 2 are shown for select bones (femur, n = 6; tibia, n = 6; sternum, n = 10; lumbar, n = 7; tail, n = 6; all are mean ± s.d.). Cd, caudal (vertebrae); L, lumbar; S, sacral; T, thoracic.

