Figure 6.
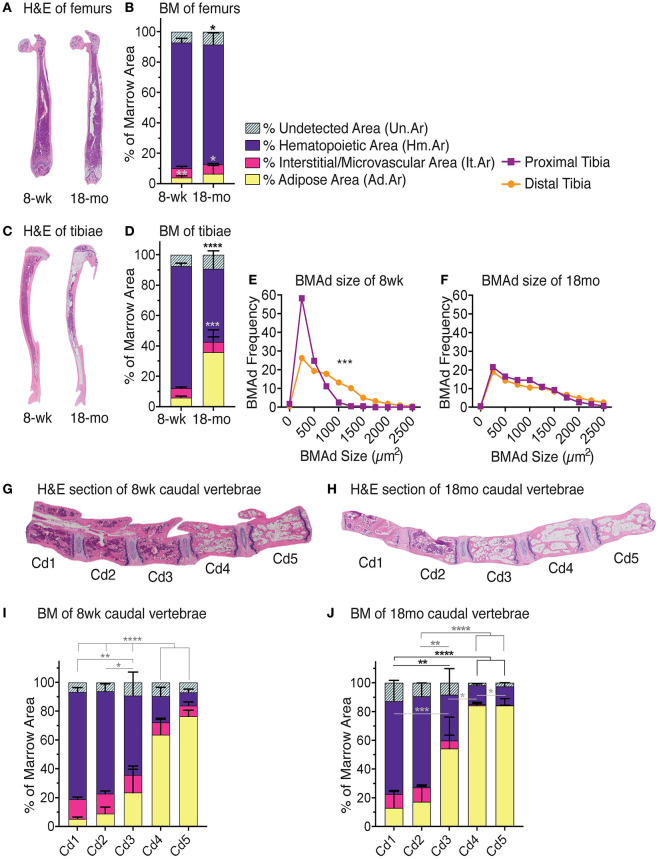
Red-to-yellow transition with aging. Representative H&E images of femurs (A) tibiae (C). Note high adiposity on proximal and distal but not mid-shaft of 18-months-old female tibia. MarrowQuant analysis for (B) femurs (n = 3) and (D) tibiae (n = 3) from 8-weeks-old and 18-months-old C57BL/6 females. BM adiposity is significantly higher in 8-weeks-old tibias vs. femurs (P = 0.0045) and in 18-months-old tibias vs. femurs (P = 0.0316). Hematopoiesis is greater in 18-months-old femurs than tibias (P = 0.0993). Error bars represent mean ± s.d. P-values are indicated for hematopoietic compartment (purple) and adipocytic compartment (yellow) are *P < 0.05, **P < 0.01, ***P < 0.001, ****P < 0.0001 by Student's t-test for cellularity (black) and adiposity (gray). (E) BMAd fragmentation distribution of the proximal (purple) and distal (orange) 8-weeks-old tibia (n = 10) vs. (F) the 18-months-old tibia (n = 3). ***P < 0.001 by multiple comparisons test. Representative mid-longitudinal H&E section of bone marrow compartments in the proximal-to-distal caudal vertebrae of (G) 8-weeks-old and (H) 18-months-old mice. MarrowQuant analysis of caudal vertebrae in (I) 8-weeks-old (n = 6) and (J) 18-months-old (n = 4) female mice. ****P < 0.0001, **P < 0.01 for cellularity and adiposity and *P < 0.05 for cellularity by two-way ANOVA. Mice were C57BL/6 females housed at room temperature and fed a standard ad libitum chow diet. BM, bone marrow; BMAd, bone marrow adipocyte; H&E, hematoxylin and eosin; mo, month; wk, week.

