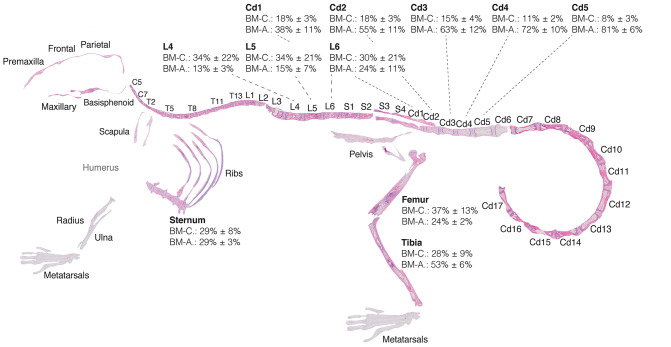
Figure 7.
Red-to-yellow-to-red transition in bone marrow aplasia and hematopoietic recovery. Skeletal map of an 8-weeks-old C57BI/6 female mouse 17 days post-lethal irradiation and transplant of 125,000 total bone marrow cells. Results for MarrowQuant quantification of hematopietic cellularity and adiposity are shown for select bones (femur, n = 3; tibia, n = 10; sternum, n = 3; lumbar, n = 4; tail, n = 4, all error bars represent mean ± s.d). Note that average adiposity (BM-A) and hematopoietic cellularity (BM-C) are homogenous across the axial skeleton (lumbar vertebrae and sternum) and femur, while the tibia and caudal vertebrae present higher adiposity and lower cellularity. BM-C is higher in sternum than Cd5 (P = 0.0001) and Cd4 (P = 0.0002), while BM-A is higher in Cd-5 (P < 0.0001) and Cd4 (P = 0.0002) than sternum by Student's t-test. Cd, caudal (vertebrae); L, lumbar; S, sacral; T, thoracic.

