Figure 8.
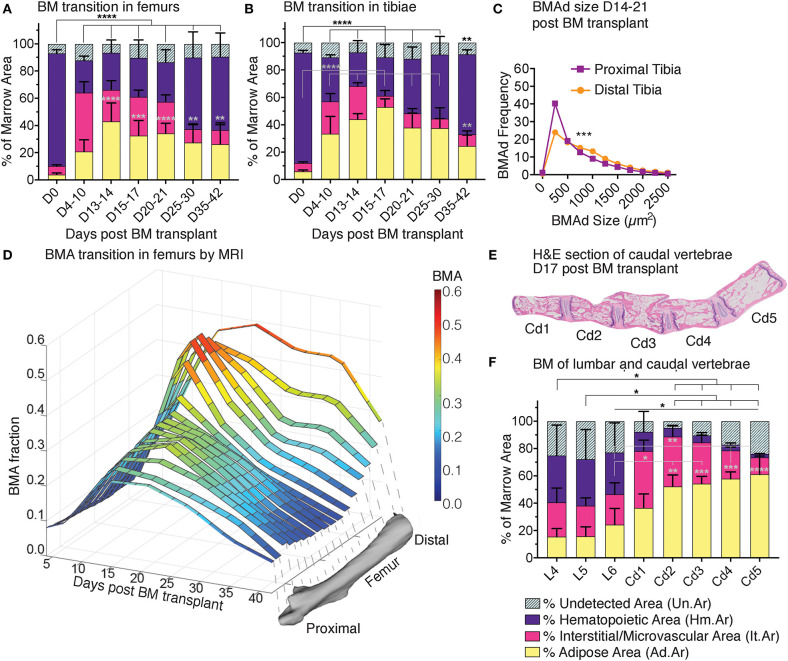
Red-to-yellow-to-red transit ion in bone marrow aplasia and hematopoietic recovery. MarrowQuant results for quantifications of (A) femurs and (B) tibiae in hematopoietic recovery at 0–42 days post lethal irradiation and transplant of 125,000 total bone marrow cells in 2-months-old C57BL/6 female mice. ****P < 0.0001, ***P < 0.001, **P < 0.01, *P < 0.05 by two-way ANOVA for cellularity (black) and adiposity (gray). (C) BMAd size fragmentation distribution in the proximal and distal tibia at peak of aplasia on days 17–21 (n = 10 tibiae) from MarrowQuant measurements extracted from (B). (D) Changes in BMA fraction measured by MRI after lethal irradiation and total BM transplant as a time-course of recovery in the whole femur in vivo under the same conditions as (A), n = 3–5 bones per time point. ***P < 0.001 by multiple comparisons test. (E) Mid-longitudinal H&E section and (F) quantification of bone marrow compartments in the proximal-to-distal caudal vertebrae at day 17 post lethal irradiation and transplant of 125,000 total bone marrow cells in 2-months-old C57BL/6 female mice. ****P < 0.0001, **P < 0.01, and *P < 0.05 for BM adiposity by two-way ANOVA. All error bars represent mean ± s.d. Mice were housed at room temperature and fed a standard ad libitum chow diet. BM, bone marrow; BMA, bone marrow adiposity; BMAd, bone marrow adipocyte; Cd, caudal (vertebrae); D, day; L, lumbar; MRI, magnetic resonance imaging; S, sacral; T, thoracic.

