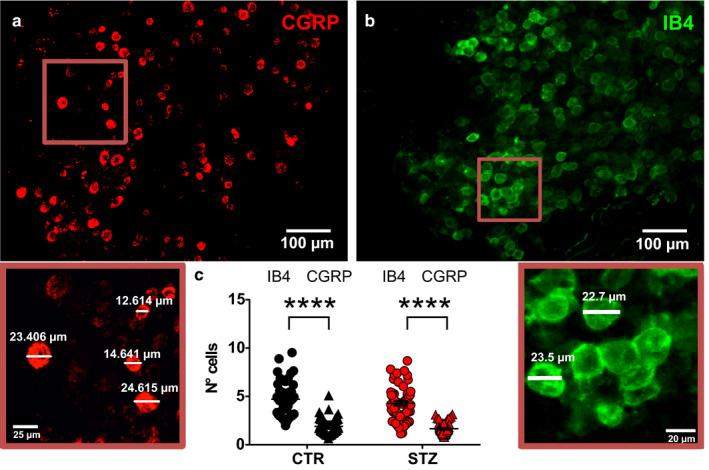
FIGURE 1.

Cluster analysis of CGRP+ and IB4+ neurons in DRGs from control and diabetic mice. Representative pictures of CGRP+ (a) and IB4+ (b) neurons in DRGs from CTR. The enlargements below illustrate the diameters of representative CGRP+ and IB4+ cells. (c) Histogram showing the number of cells per cluster of CGRP+ and IB4+ neurons in vehicle‐treated (IB4+ n = 48; CGRP, n = 58; t‐test, p < .001) and STZ‐treated mice (IB4+ n = 57; CGRP, n = 56; t‐test, p < .001). CGRP, calcitonin gene‐related peptide; CTR, vehicle‐treated mice; IB4, isolectin B4; STZ, streptozotocin‐treated mice. ****p < .0001
