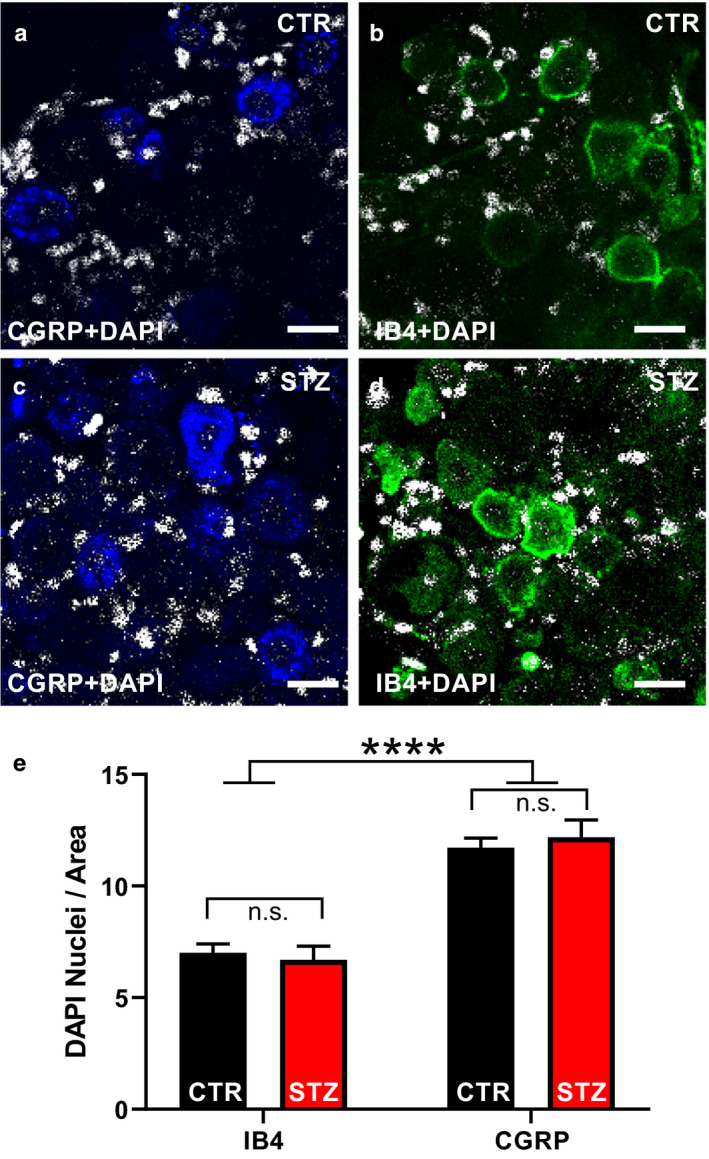
FIGURE 2.

Analysis of the changes in the number of SGCs induced by STZ. (a–d) Representative pictures of CGRP (blue), IB4 (green) and DAPI (white) staining on whole‐mount DRGs. (e) Histograms illustrating the number of DAPI+ nuclei surrounding CGRP+ or IB4+ sensory neurons normalized to the cross‐sectional area in vehicle‐ and STZ‐ treated mice. Two‐way ANOVA: effect of treatment: F (1, 216) = 0.02, p = .89; effect of the cell phenotype: F (1, 216) = 84.89, p < .001; interaction between treatment and phenotype: F (1, 216) = 0.48, p = .16. t‐Test: IB4‐CTR vs. CGRP‐CTR, IB4‐CTR vs. CGRP‐STZ, IB4‐STZ vs. CGRP‐CTR, IB4‐STZ vs. CGRP‐STZ, p < .001; IB4‐CTR vs. IB4‐STZ, CGRP‐CTR vs. CGRP‐STZ, p > .05). CGRP, calcitonin gene‐related peptide; CTR, vehicle‐treated mice; DAPI, 4′,6‐diamidino‐2‐phenylindole; IB4, isolectin B4; STZ, streptozotocin‐treated mice. ****p < .0001
