FIGURE 3.

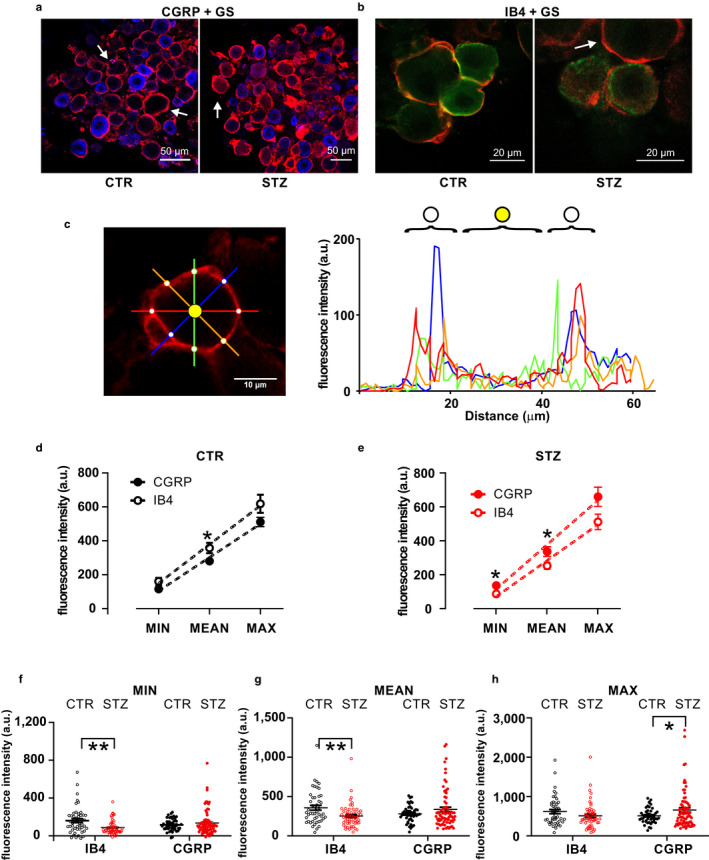
GS immunostaining and analysis of SGC coverage of CGRP+ and IB4+ neurons. (a,b) Representative images showing double staining for the SGC marker GS (red), the peptidergic DRG neuron marker CGRP (blue, a), and the non‐peptidergic DRG neuron marker IB4 (green, b) in vehicle‐treated and STZ‐treated mice. (c) Method for GS staining analysis. On the left, representative single optical section of GS staining around a DRG neuron. Fluorescence intensity is measured along the four colored lines, which cross the ensheathing SGC at eight points (white dots) around the DRG neuron. Quantification of the fluorescence intensity along each colored line is illustrated in the graph on the right, using the same color code. GS fluorescence intensity is measured at the white dots, i.e. the peaks in the graphs, and then normalized to internal background (yellow dot). (d) Minimal, mean and maximal GS fluorescence intensities around CGRP+ or IB4+ neurons in vehicle‐treated mice. t‐test: min, p = .053; mean, p = .028; max, p = .079. (e) Minimal, mean and maximal GS fluorescence intensities around CGRP+ or IB4+ neurons in STZ‐treated mice. t‐test: min, p = .016; mean, p = .028; max, p = .056. (f) Dot plot graph of minimal GS fluorescence intensity. Two‐way ANOVA: interaction between treatment and phenotype: F (1, 218) = 9.49, p = .002; effect of treatment: F (1, 218) = 2.99, p = .085; effect of the cell phenotype: F (1, 218) = 0.02, p = .88. IB4‐CTR vs. IB4‐STZ, t‐test, p = .0014; CGRP‐CTR vs. CGRP‐STZ, t‐test, p = .32. (g) Dot plot graph of mean GS fluorescence intensity. Two‐way ANOVA: interaction between treatment and phenotype: F (1, 218) = 9.26, p = .003; effect of treatment: F (1, 218) = 8.45, p = .36; effect of the cell phenotype: F (1, 218) = 0.015, p = .9. IB4‐CTR vs. IB4‐STZ, t‐test, p = .005; CGRP‐CTR vs. CGRP‐STZ, t‐test, p = .14. (h) Dot plot graph of maximal GS fluorescence intensity. Two‐way ANOVA: interaction between treatment and phenotype: F (1, 218) = 6.12, p = .014; effect of treatment: F (1, 218) = 0.17, p = .68; effect of the cell phenotype: F (1, 218) = 0.017, p = .69. IB4‐CTR vs. IB4‐STZ, t‐test, p = .13; CGRP‐CTR vs. CGRP‐STZ, t‐test, p = .048. CGRP, calcitonin gene‐related peptide; CTR, vehicle‐treated mice; GS, glutamine synthetase; IB4, isolectin B4; STZ, streptozotocin‐treated mice;. *p < .05, **p < .01
