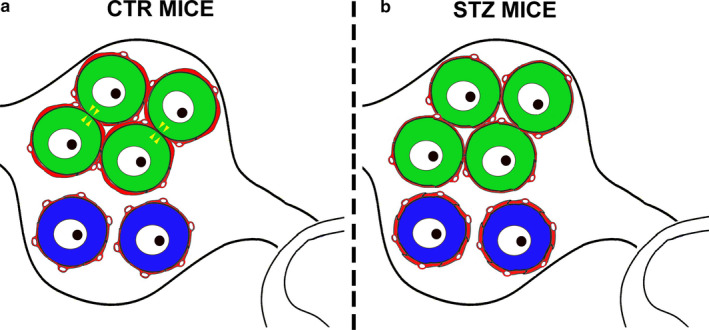
FIGURE 6.

Schematic summary of neuro‐glia relationship in DRGs of control and diabetic mice. (a) Representation of a simplified dorsal root ganglion (DRG) in control (CTR) mice: IB4+ neurons (green) are grouped in a cluster and surrounded by a few satellite glial cells (SGC). SGCs form a continuous glutamine synthetase (GS)+ sheet around neurons (red thick line) which becomes thinner at the interface of two IB4+ opposing neurons. At some points, the membranes of cluster‐forming IB4+ neurons are in direct contact (yellow arrowheads). CGRP+ neurons (blue) are randomly scattered across the DRG and surrounded by numerous SGCs with relatively less bright GS immunostaining (red thin line). (b) In streptozotocin (STZ)‐induced diabetic mice, IB4+ neurons (green) are still grouped in clusters and CGRP+ neurons (blue) randomly scattered across the DRG. However, GS fluorescence intensity is higher around CGRP+ neurons (red thick line) than in IB4+ neurons (red thin line). Moreover, the number of points of the cluster where two IB4+ opposing neurons are in direct contact is significantly reduced
