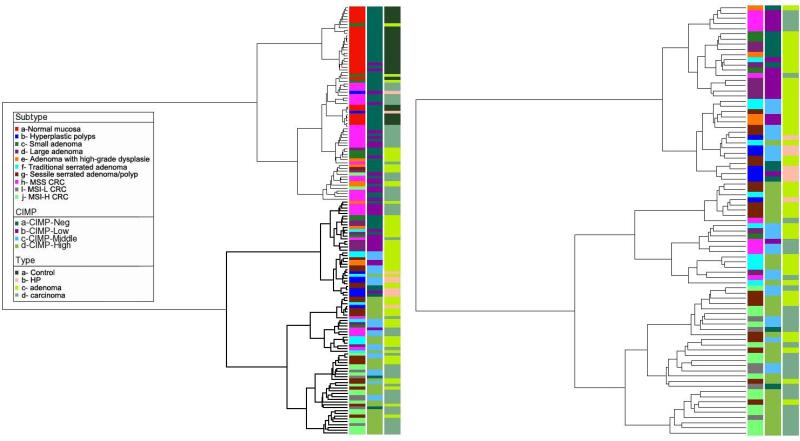
Figure 3.
Supervised hierarchical clustering of methylation data suggests the existence of four groups: Branch 1, majority of normal samples; Branch 2, majority of MSS CRCs and small adenomas; Branch 3, majority of HPs, large adenomas, TSAs and half of SSA/Ps, Branch 4, majority of MSI-H CRC, MSI-L CRC and half of SSA/Ps. SSA/Ps located in close proximity to MSI-H CRCs, TSAs cluster closer to MSS CRCs. MSI-L CRCs are located close to MSI-H CRCs. Abbreviations: CIMP: CpG island methylation; HP: hyperplastic polyp; CRC: colorectal cancer; MSS: microsatellite stable; MSI-L: low microsatellite instable; MSI-H: high microsatellite instable.

