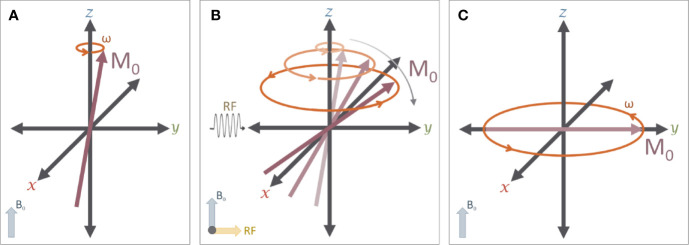
Figure 3.
The effects of a RF pulse: (A) A typical MR experiment begins with protons in a strong magnetic field (B0) that is aligned with the z axis (down the bore of the MR scanner). As noted in Figure 2, these protons spin on their axis (grey arrow), generating a small amount of net magnetization (M0, red arrow)) that precesses around the z-axis (orange arrow) at the Larmor frequency (ω). (B) A 90° radiofrequency (RF) pulse is applied to the system in order to “tip” M0 into the transverse (X-Y) plane. The net magnetization M0 will exhibit a spiral trajectory from the initial starting orientation as shown. (C) Immediately after the RF pulse is removed, the net magnetization (M0) is rotating around the z-axis on the transverse plane.

