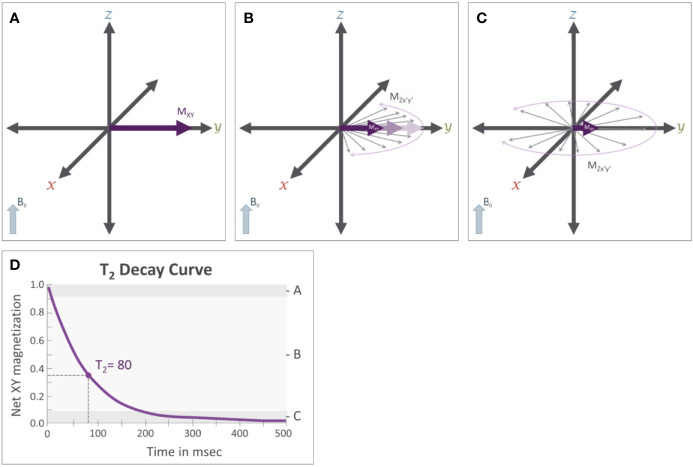
Figure 5.
T2 relaxation: Immediately after the application of a 90° RF pulse (see Figure 3C) (A) the net magnetization of the population of protons is rotating along the transverse plane at the Larmor frequency (ω). Importantly, these protons are rotating in phase with each other. (B) T2 relaxation results from subtle variations that occur in the magnetic field that cause slight variation in the Larmor frequency of individual protons. This results in a loss of coherence where some protons are rotating faster while others rotate more slowly; causing the magnetic fields of individual protons, represented by the thin gray arrows, to be slightly out of phase with each other and causing the net magnetization (MXY) in the transverse plane to decrease. (C) After sufficient time has passed, these individual protons will be distributed randomly along the transverse plane, causing Mxy to approach 0. (D) This reduction in Mxy follows an exponential decay curve and the T2 relaxation time constant.

